PROTECTED SOURCE SCRIPT
45pointsJ3FF Enhanced
# 45pointsJ3FF Enhanced Pine Script Indicator
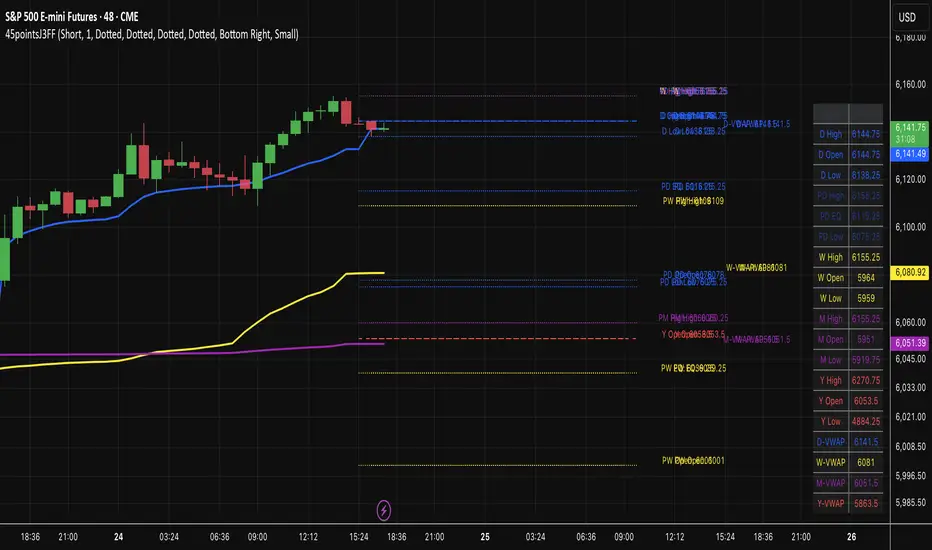
This is a comprehensive multi-timeframe support and resistance indicator for TradingView that displays key price levels and VWAP (Volume Weighted Average Price) across different time periods.
## 🎯 **Core Functionality**
The indicator plots critical price levels from multiple timeframes simultaneously on your chart, helping traders identify key support/resistance zones and volume-based price levels.
## 📊 **Key Levels Displayed**
### **Multi-Timeframe Levels:**
- **Daily**: Open, High, Low + Previous Day levels
- **Weekly**: Open, High, Low + Previous Week levels
- **Monthly**: Open, High, Low + Previous Month levels
- **Yearly**: Open, High, Low + Previous Year levels
### **Equilibrium Levels:**
- **50% Retracement** levels for previous periods (midpoint between high and low)
- Helps identify potential reversal zones
### **VWAP Levels:**
- **Daily VWAP**: Volume-weighted average for current day
- **Weekly VWAP**: Custom calculation for current week
- **Monthly VWAP**: Custom calculation for current month
- **Yearly VWAP**: Custom calculation for current year
## ⚙️ **Customization Options**
### **Display Controls:**
- **Individual toggles** for each timeframe (Daily/Weekly/Monthly/Yearly)
- **Previous period toggles** to show/hide historical levels
- **Line extension options**: Short, Right, Both
- **Adjustable line width** (1-3 pixels)
### **Visual Customization:**
- **Custom colors** for each timeframe
- **Individual line styles** (Solid, Dashed, Dotted) for each timeframe
- **Price labels** can be toggled on/off for lines and VWAPs
### **Price Table Features:**
- **Comprehensive side table** showing all active level prices
- **4 position options**: Top/Bottom + Left/Right corners
- **3 size options**: Small, Normal, Large
- **Color-coded entries** matching chart lines
- **Auto-filtering**: Only shows enabled levels
## 🔧 **Technical Implementation**
### **VWAP Calculations:**
- **Daily**: Uses built-in `ta.vwap()` function
- **Weekly/Monthly/Yearly**: Custom accumulative calculations using volume-weighted price averaging
- **Timeframe Detection**: Higher timeframe VWAPs only show on intraday charts
### **Higher Timeframe Data:**
- Uses `request.security()` to fetch OHLC data from higher timeframes
- **Lookahead enabled** for real-time updates
- **Previous period data** accessed using `[1]` historical referencing
### **Drawing System:**
- **Dynamic line drawing** with customizable extension
- **Smart labeling system** with price formatting
- **Tick-rounded prices** for clean display
- **Performance optimized** with conditional drawing
## 📈 **Trading Applications**
### **Support & Resistance:**
- **Previous day/week/month highs and lows** act as key S/R levels
- **Opening levels** often serve as pivot points
- **Equilibrium levels** (50% retracements) are common reversal zones
### **VWAP Trading:**
- **Daily VWAP**: Intraday trend direction and mean reversion
- **Higher timeframe VWAPs**: Longer-term trend bias
- **Multiple VWAP confluence** creates stronger levels
### **Multi-Timeframe Analysis:**
- **Level confluence**: Multiple timeframes aligning creates stronger zones
- **Trend context**: Higher timeframe levels provide broader market context
- **Entry/Exit planning**: Previous period levels help plan trades
## 🎨 **Visual Organization**
### **Color Coding:**
- **Blue**: Daily levels (default)
- **Yellow**: Weekly levels (default)
- **Purple**: Monthly levels (default)
- **Red**: Yearly levels (default)
- **Transparency**: Previous period levels shown in lighter shades
### **Line Styles:**
- **Solid lines**: Current period highs/lows
- **Dashed lines**: Opening levels
- **Dotted lines**: Previous period levels
- **Thick lines**: VWAP plots (2px width)
## 🔍 **Unique Features**
1. **Custom VWAP calculations** for weekly/monthly/yearly periods
2. **Intelligent table display** that only shows active levels
3. **Comprehensive customization** without overwhelming interface
4. **Performance optimized** with conditional rendering
5. **Professional presentation** with watermark and clean styling
This indicator is particularly valuable for traders who use multiple timeframe analysis and want a clean, organized way to visualize key price levels and volume-based averages all in one tool.
Korumalı komut dosyası
Bu komut dosyası kapalı kaynak olarak yayınlanmaktadır. Ancak, ücretsiz ve herhangi bir sınırlama olmaksızın kullanabilirsiniz – daha fazla bilgiyi buradan edinebilirsiniz.
Feragatname
Bilgiler ve yayınlar, TradingView tarafından sağlanan veya onaylanan finansal, yatırım, alım satım veya diğer türden tavsiye veya öneriler anlamına gelmez ve teşkil etmez. Kullanım Koşulları bölümünde daha fazlasını okuyun.