Manipulation/Distribution[cem_trades]
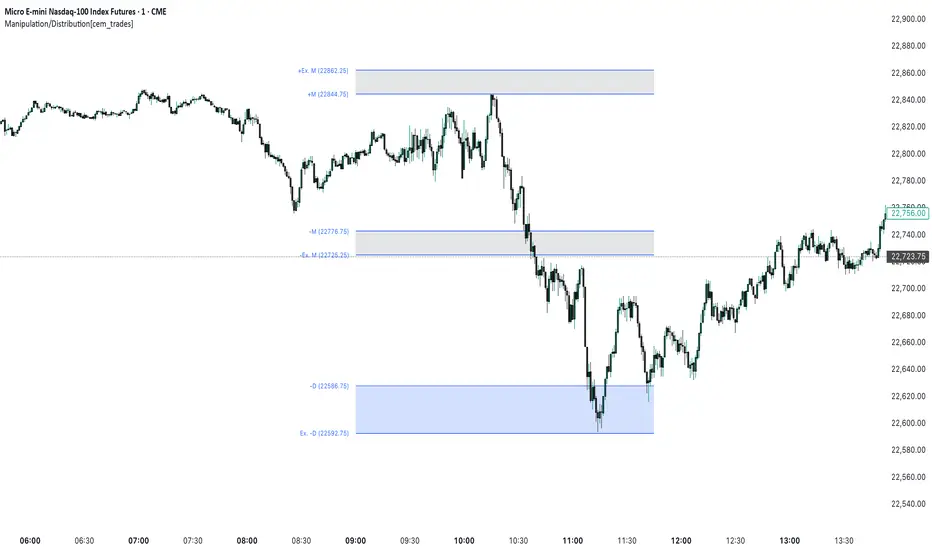
- Bearish Manipulation Zone (-M to -Ex. M)
- Bullish Distribution Zone (+D to +Ex. D)
- Bullish Manipulation Zone (+M to +Ex. M)
- Bearish Distribution Zone (-D to -Ex. D)
The manipulation zones (M) are located closer to the current price and represent areas where stop hunts or false breakouts are statistically more likely. If price enters and reacts within one of these zones, the opposite distribution zone (D) becomes a potential target.
The Extended (Ex.) levels visualize the wider boundary for each zone based on historical expansion data, helping traders frame directional bias and risk levels.
This indicator is particularly useful for:
- Detecting possible liquidity grabs
- Anticipating reversals or continuations after manipulation
- Structuring trades with defined invalidation and target zones
Note: This invite-only script uses a proprietary model for dynamic zone placement and boundary extension logic that is not found in open-source scripts.
Yalnızca davetli komut dosyası
Only users approved by the author can access this script. You'll need to request and get permission to use it. This is typically granted after payment. For more details, follow the author's instructions below or contact cem_trades directly.
TradingView, yazarına tam olarak güvenmediğiniz ve nasıl çalıştığını anlamadığınız sürece bir komut dosyası için ödeme yapmanızı veya kullanmanızı ÖNERMEZ. Ayrıca topluluk komut dosyaları bölümümüzde ücretsiz, açık kaynaklı alternatifler bulabilirsiniz.
Yazarın talimatları
Uyarı: Erişim talebinde bulunmadan önce lütfen yalnızca davetli komut dosyaları kılavuzumuzu okuyun.
Feragatname
Yalnızca davetli komut dosyası
Only users approved by the author can access this script. You'll need to request and get permission to use it. This is typically granted after payment. For more details, follow the author's instructions below or contact cem_trades directly.
TradingView, yazarına tam olarak güvenmediğiniz ve nasıl çalıştığını anlamadığınız sürece bir komut dosyası için ödeme yapmanızı veya kullanmanızı ÖNERMEZ. Ayrıca topluluk komut dosyaları bölümümüzde ücretsiz, açık kaynaklı alternatifler bulabilirsiniz.
Yazarın talimatları
Uyarı: Erişim talebinde bulunmadan önce lütfen yalnızca davetli komut dosyaları kılavuzumuzu okuyun.