OPEN-SOURCE SCRIPT
Güncellendi Previous 2 Days High/Low
Can you give me a summary of this indicator
The "Previous 2 Days High/Low" indicator, written in Pine Script v5 for TradingView, plots horizontal lines representing the combined high and low prices of the previous two trading days on a chart. Here's a summary of its functionality, purpose, and key features:
Purpose
The indicator helps traders identify significant price levels by displaying the highest high and lowest low from the previous two days, which can act as potential support or resistance levels. These levels are plotted as lines that extend across the current trading day, making it easier to visualize key price zones for trading decisions.
Key Features
Calculates Combined High and Low:
Retrieves the high and low prices of the previous day and the day before using request.security on the daily timeframe ("D").
Computes the combined high as the maximum of the two days' highs and the combined low as the minimum of the two days' lows.
Dynamic Line Plotting:
Draws two horizontal lines:
Red Line: Represents the combined high, plotted at the highest price of the previous two days.
Green Line: Represents the combined low, plotted at the lowest price of the previous two days.
Lines are created at the start of a new trading day and extended to the right edge of the chart using line.set_x2, ensuring they span the entire current day.
Labels for Clarity:
Adds labels to the right of the chart, displaying the exact price values of the combined high ("Combined High: [price]") and combined low ("Combined Low: [price]").
Labels are updated to move with the lines, maintaining alignment at the current bar.
Clutter Prevention:
Deletes old lines and labels at the start of each new trading day to avoid overlapping or excessive objects on the chart.
Dynamic Requests:
Uses dynamic_requests=true in the indicator() function to allow request.security calls within conditional blocks (if ta.change(time("D"))), enabling daily data retrieval within the script's logic.
Sürüm Notları
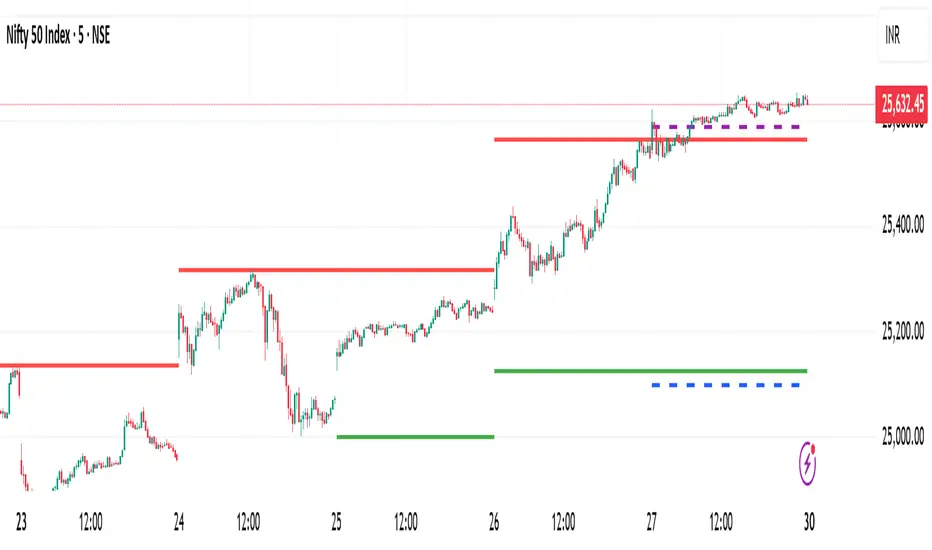
Summary of IndicatorPurpose: Displays the combined high and low of the previous two trading days, plus new levels calculated as:
New High: Combined high + 0.5% of combined high.
New Low: Combined low - 0.5% of combined high.
Plots:
Combined High: Red solid line, labeled "Combined High: [price]".
Combined Low: Green solid line, labeled "Combined Low: [price]".
New High: Purple dashed line, labeled "New High: [price]".
New Low: Blue dashed line, labeled "New Low: [price]".
Line Extension: All lines start at the beginning of the current day and extend to the right edge of the chart, updating dynamically with each new bar.
Labels: Move with the lines, positioned to the right for clarity.
Data Retrieval: Uses request.security to fetch daily highs and lows from the previous two days, with dynamic_requests=true to allow conditional data fetching.
Cleanup: Deletes old lines and labels on each new day to prevent chart clutter.
Sürüm Notları
Expected Behavior on a 5-Minute ChartHistorical Days (up to 30 days or ~June 2025, depending on data availability):
Red solid lines (combined high) and green solid lines (combined low) for each day, spanning the entire day (~288 bars for 24-hour markets, fewer for stocks).
Lines should extend back to the earliest available data or the max_days limit (30 days, adjustable).
Current Day:
Four lines: red solid (combined high), green solid (combined low), purple dashed (new high), blue dashed (new low).
Lines extend from the start of the current day to the current bar, appearing as full lines (not dashes) on the 5-minute chart.
No Labels: No labels are drawn.
Açık kaynak kodlu komut dosyası
Gerçek TradingView ruhuyla, bu komut dosyasının mimarı, yatırımcıların işlevselliğini inceleyip doğrulayabilmesi için onu açık kaynaklı hale getirdi. Yazarı tebrik ederiz! Ücretsiz olarak kullanabilseniz de, kodu yeniden yayınlamanın Topluluk Kurallarımıza tabi olduğunu unutmayın.
Feragatname
Bilgiler ve yayınlar, TradingView tarafından sağlanan veya onaylanan finansal, yatırım, alım satım veya diğer türden tavsiye veya öneriler anlamına gelmez ve teşkil etmez. Kullanım Koşulları bölümünde daha fazlasını okuyun.