OPEN-SOURCE SCRIPT
Güncellendi Price Change History
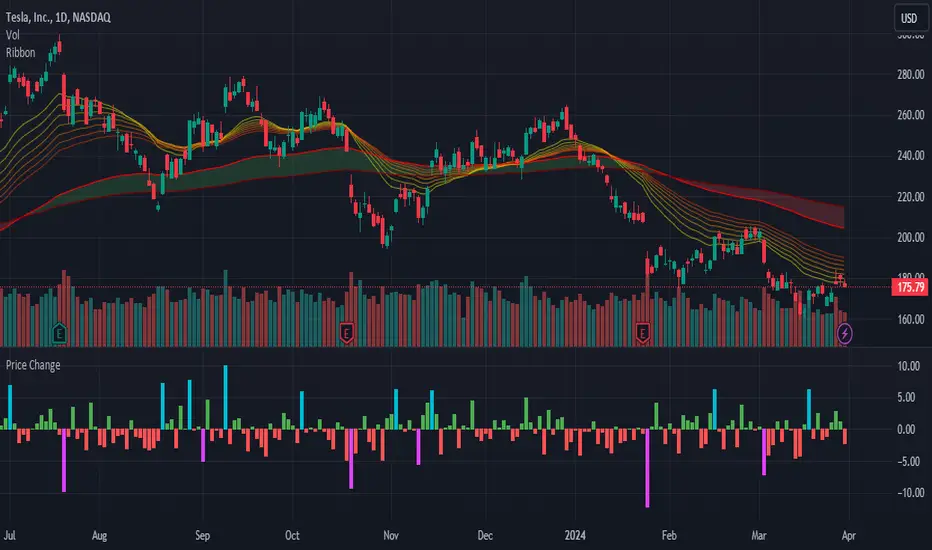
Display a histogram of price changes over a given interval. Show change as a percentage or in dollar amount. Highlight changes that exceed a particular value.
Sürüm Notları
By default, the histogram shows price change since the previous bar. This update allows you to display price change since any number of bars ago.Sürüm Notları
Separate high and low highlighting.Sürüm Notları
Update study shorttitle.Sürüm Notları
The ratio of highlighted to unhighlighted bars is now shown as the orange number ranging from 0 to 1.It takes into consideration the previous 50 bars by default, but can be changed by the user under settings.
Sürüm Notları
- Updated the names of a few settings to be clearer as to what they do.- Included some documentation in the source code to explain each setting.
Sürüm Notları
- Add default precision
- Improve comments
Sürüm Notları
Updated to Pine Script v4Sürüm Notları
- Update to Pine Script v5- Additional comments
- Code cleanup
Açık kaynak kodlu komut dosyası
Gerçek TradingView ruhuna uygun olarak, bu komut dosyasının oluşturucusu bunu açık kaynaklı hale getirmiştir, böylece yatırımcılar betiğin işlevselliğini inceleyip doğrulayabilir. Yazara saygı! Ücretsiz olarak kullanabilirsiniz, ancak kodu yeniden yayınlamanın Site Kurallarımıza tabi olduğunu unutmayın.
Feragatname
Bilgiler ve yayınlar, TradingView tarafından sağlanan veya onaylanan finansal, yatırım, işlem veya diğer türden tavsiye veya tavsiyeler anlamına gelmez ve teşkil etmez. Kullanım Şartları'nda daha fazlasını okuyun.