PROTECTED SOURCE SCRIPT
ATR Stop Loss Bands
ATR Stop Loss Bands Indicator
Overview
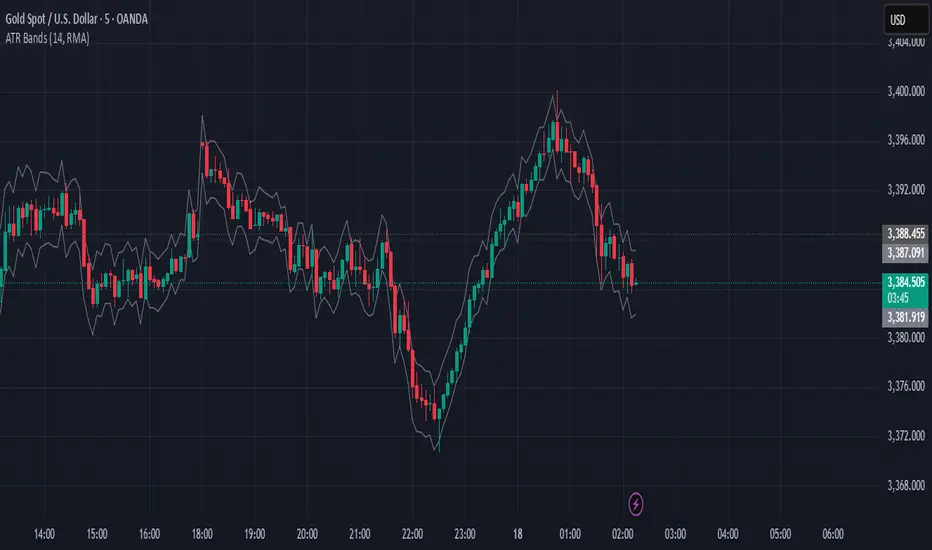
The ATR Stop Loss Bands indicator creates dynamic support and resistance levels based on the Average True Range (ATR), providing traders with volatility-adjusted price bands that can be used for stop loss placement and trend analysis.
How It Works
This indicator calculates two bands around the current closing price using the ATR value:
Upper Band: Close price + ATR value
Lower Band: Close price - ATR value
The bands automatically adjust to market volatility, expanding during volatile periods and contracting during calmer market conditions.
Key Features
Customizable ATR Period: Default 14-period length (adjustable from 1 to any desired value)
Multiple Smoothing Options: Choose from RMA (default), SMA, EMA, or WMA for ATR calculation
Dynamic Volatility Adjustment: Bands automatically adapt to current market volatility
Clean Visual Design: Gray bands that don't clutter your chart
Trading Applications
Stop Loss Placement: Use the bands as dynamic stop loss levels - long positions might use the lower band as a stop, while short positions could use the upper band
Volatility Assessment: Wide bands indicate high volatility periods, narrow bands suggest low volatility
Breakout Identification: Price movements beyond the bands may signal potential breakouts or trend changes
Support/Resistance Levels: The bands can act as dynamic support and resistance zones
Settings
Length: ATR calculation period (default: 14)
Smoothing: Method for ATR smoothing (RMA, SMA, EMA, or WMA)
Best Practices
Use in conjunction with other technical analysis tools for confirmation
Consider the overall trend direction when interpreting band breaks
Adjust the length parameter based on your trading timeframe and strategy
Remember that ATR bands are reactive, not predictive - they respond to price movements rather than forecasting them
This indicator is particularly useful for traders who want to incorporate market volatility into their risk management and entry/exit decisions.
Overview
The ATR Stop Loss Bands indicator creates dynamic support and resistance levels based on the Average True Range (ATR), providing traders with volatility-adjusted price bands that can be used for stop loss placement and trend analysis.
How It Works
This indicator calculates two bands around the current closing price using the ATR value:
Upper Band: Close price + ATR value
Lower Band: Close price - ATR value
The bands automatically adjust to market volatility, expanding during volatile periods and contracting during calmer market conditions.
Key Features
Customizable ATR Period: Default 14-period length (adjustable from 1 to any desired value)
Multiple Smoothing Options: Choose from RMA (default), SMA, EMA, or WMA for ATR calculation
Dynamic Volatility Adjustment: Bands automatically adapt to current market volatility
Clean Visual Design: Gray bands that don't clutter your chart
Trading Applications
Stop Loss Placement: Use the bands as dynamic stop loss levels - long positions might use the lower band as a stop, while short positions could use the upper band
Volatility Assessment: Wide bands indicate high volatility periods, narrow bands suggest low volatility
Breakout Identification: Price movements beyond the bands may signal potential breakouts or trend changes
Support/Resistance Levels: The bands can act as dynamic support and resistance zones
Settings
Length: ATR calculation period (default: 14)
Smoothing: Method for ATR smoothing (RMA, SMA, EMA, or WMA)
Best Practices
Use in conjunction with other technical analysis tools for confirmation
Consider the overall trend direction when interpreting band breaks
Adjust the length parameter based on your trading timeframe and strategy
Remember that ATR bands are reactive, not predictive - they respond to price movements rather than forecasting them
This indicator is particularly useful for traders who want to incorporate market volatility into their risk management and entry/exit decisions.
Korumalı komut dosyası
Bu komut dosyası kapalı kaynak olarak yayınlanmaktadır. Ancak, ücretsiz ve herhangi bir sınırlama olmaksızın kullanabilirsiniz – daha fazla bilgiyi buradan edinebilirsiniz.
Feragatname
Bilgiler ve yayınlar, TradingView tarafından sağlanan veya onaylanan finansal, yatırım, alım satım veya diğer türden tavsiye veya öneriler anlamına gelmez ve teşkil etmez. Kullanım Koşulları bölümünde daha fazlasını okuyun.