PROTECTED SOURCE SCRIPT
Bollinger RSI Stochastic Strategy by TitikSona
🧠 Description
Bollinger RSI Stochastic Strategy by TitikSona
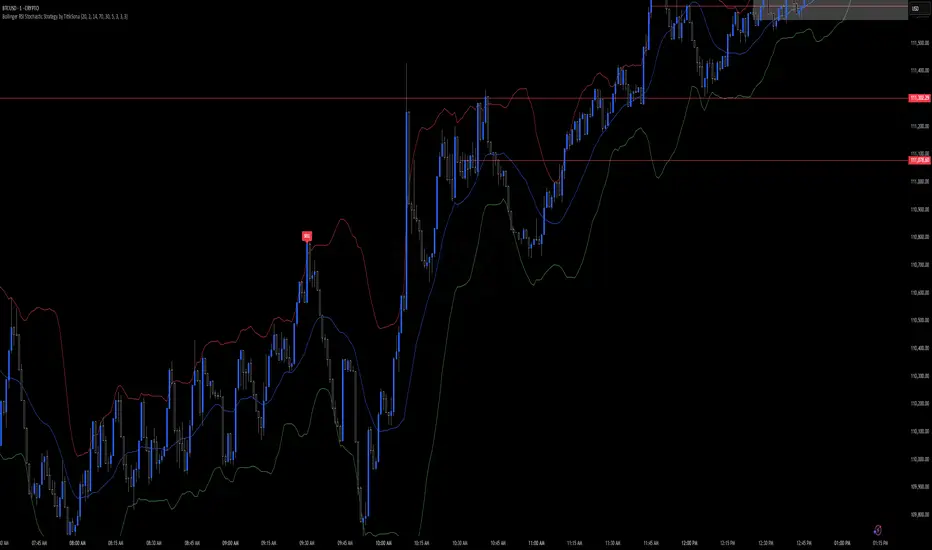
This indicator combines Bollinger Bands, RSI, and Stochastic to provide an educational view of potential market conditions. It highlights areas where price, momentum, and volatility align, helping traders observe overbought and oversold conditions with optional re-entry tracking.
⚙️ Core Components
1. Bollinger Bands
- 20-period SMA as basis, with adjustable standard deviation
- Upper and lower bands highlight price extremes and potential volatility zones
2. RSI (Relative Strength Index)
- 14-period RSI with overbought and oversold thresholds
- Helps identify potential momentum exhaustion areas
3. Stochastic Oscillator
- %K and %D with smoothing
- Provides confirmation of momentum shifts within Bollinger Bands context
🎯 Observing Signals
- Buy condition: price near lower Bollinger Band, RSI below oversold, and %K crosses above %D
- Sell condition: price near upper Bollinger Band, RSI above overbought, and %K crosses below %D
- Signals are **informational markers** displayed as labels on the chart
- Maximum re-entries per trade can be tracked for observation purposes
- Does not guarantee profitable trades; used as a reference for market analysis
💡 How to Use
- Observe signals as **potential reference points**, not guaranteed entry points
- Combine with other technical analysis tools, such as support/resistance, trendlines, or volume for confirmation
- Adjust parameters to suit your preferred timeframe and market conditions
⚠️ Risk Management
- This indicator is **educational** and does not guarantee profits
- Always use proper position sizing and risk controls
- Test thoroughly in demo or paper trading environment before live application
🆓 Open & Free
- Fully open-source and free to use or modify for learning purposes
Bollinger RSI Stochastic Strategy by TitikSona
This indicator combines Bollinger Bands, RSI, and Stochastic to provide an educational view of potential market conditions. It highlights areas where price, momentum, and volatility align, helping traders observe overbought and oversold conditions with optional re-entry tracking.
⚙️ Core Components
1. Bollinger Bands
- 20-period SMA as basis, with adjustable standard deviation
- Upper and lower bands highlight price extremes and potential volatility zones
2. RSI (Relative Strength Index)
- 14-period RSI with overbought and oversold thresholds
- Helps identify potential momentum exhaustion areas
3. Stochastic Oscillator
- %K and %D with smoothing
- Provides confirmation of momentum shifts within Bollinger Bands context
🎯 Observing Signals
- Buy condition: price near lower Bollinger Band, RSI below oversold, and %K crosses above %D
- Sell condition: price near upper Bollinger Band, RSI above overbought, and %K crosses below %D
- Signals are **informational markers** displayed as labels on the chart
- Maximum re-entries per trade can be tracked for observation purposes
- Does not guarantee profitable trades; used as a reference for market analysis
💡 How to Use
- Observe signals as **potential reference points**, not guaranteed entry points
- Combine with other technical analysis tools, such as support/resistance, trendlines, or volume for confirmation
- Adjust parameters to suit your preferred timeframe and market conditions
⚠️ Risk Management
- This indicator is **educational** and does not guarantee profits
- Always use proper position sizing and risk controls
- Test thoroughly in demo or paper trading environment before live application
🆓 Open & Free
- Fully open-source and free to use or modify for learning purposes
Korumalı komut dosyası
Bu komut dosyası kapalı kaynak olarak yayınlanmaktadır. Ancak, özgürce ve herhangi bir sınırlama olmaksızın kullanabilirsiniz – daha fazla bilgi burada.
Feragatname
Bilgiler ve yayınlar, TradingView tarafından sağlanan veya onaylanan finansal, yatırım, işlem veya diğer türden tavsiye veya tavsiyeler anlamına gelmez ve teşkil etmez. Kullanım Şartları'nda daha fazlasını okuyun.