OPEN-SOURCE SCRIPT
relative performance

This indicator is built to mesure the performance of a stock vs the index of choice. it is best use for the intraday session because it doesn't take gap into account when doing the calculation. This is how i made my math (using AAPL compared to SPY for simplicity)
(change AAPL / ATR AAPL) - (change SPY / ATR SPY) * beta factor * volume factor
change is calculated open to close for each candle instead of close to close. this is why gap does not affect the calculation
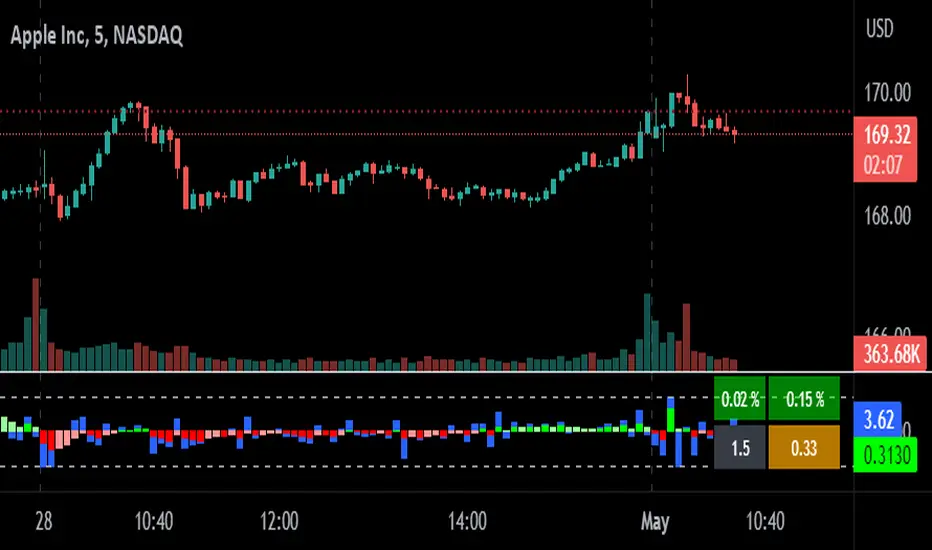
blue columns is an instant snap shot of the RP
red and green columns is the moving average of the blue columns
limit is the max value for the blue line when ploting them on the chart but doesn't affect the calculation
option:
indice: default with SPY but could use any stock
moving average choice: let you choose between EMA or SMA green and red columns
rolling average length : number of bar for the moving average
I made an auto adjust for the 5 min chart and the 2 min chart so you can swithc between both chart and have the same average (default value set to 6x 5min and 15x 2 min, giving you the average of the last 30min)
volume weighing let you choose if you want a volume factor or not. volume factor is only going to multiplie the result of the price move. it cannot move it from positive to negative.
this is the calculation
(volume AAPL / volume SMA AAPL) / (volume SPY / volume sma SPY)
meaning that a higher volume on the thicker compared to it's sma while having a lower volume on SPY will give you a big relative performance.
you can choose the number of bar in the average for the volume.
BETA factor work the same way that the volume factor does. you got to manualy enter your beta. default is set to 1.5
table
top line : blue square is you RP value (same has the blue columns bar) and your reference thicker
middle line : pourcentage move from the open (9:30 open) for your stock on the left and the reference on the right
bottom line : beta on the left and volume factor on the right
feel free to ask question or give modification idea!
Açık kaynak kodlu komut dosyası
Gerçek TradingView ruhuyla, bu komut dosyasının mimarı, yatırımcıların işlevselliğini inceleyip doğrulayabilmesi için onu açık kaynaklı hale getirdi. Yazarı tebrik ederiz! Ücretsiz olarak kullanabilseniz de, kodu yeniden yayınlamanın Topluluk Kurallarımıza tabi olduğunu unutmayın.
Feragatname
Bilgiler ve yayınlar, TradingView tarafından sağlanan veya onaylanan finansal, yatırım, alım satım veya diğer türden tavsiye veya öneriler anlamına gelmez ve teşkil etmez. Kullanım Koşulları bölümünde daha fazlasını okuyun.