OPEN-SOURCE SCRIPT
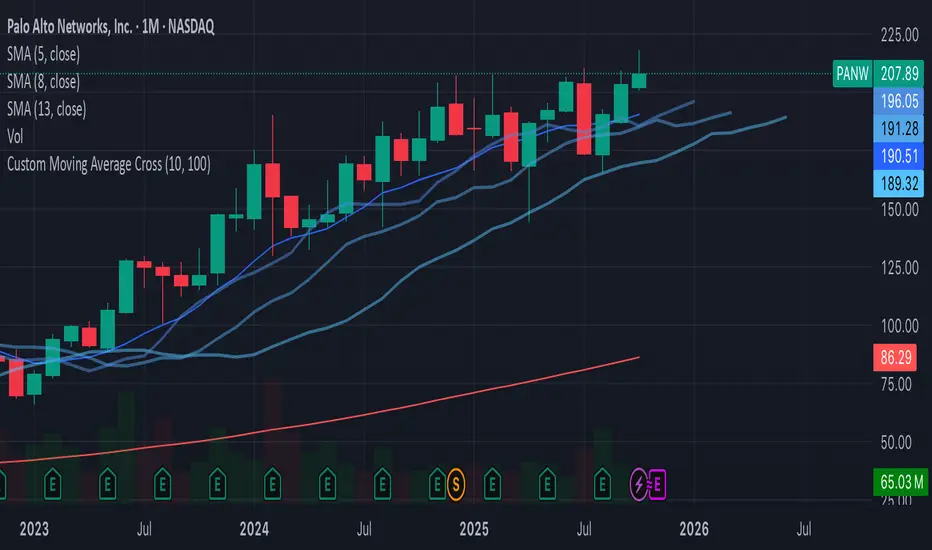
Custom Moving Average Cross - White
//version=5
indicator("Custom Moving Average Cross", overlay=true)
// User-defined parameters for moving averages
short_period = input.int(10, title="Short Period", minval=1)
long_period = input.int(100, title="Long Period", minval=1)
// Calculate the moving averages
short_ma = ta.sma(close, short_period)
long_ma = ta.sma(close, long_period)
// Plot the moving averages
plot(short_ma, color=color.blue, title="Short MA")
plot(long_ma, color=color.red, title="Long MA")
// Define the buy and sell conditions based on crossovers
buy_signal = ta.crossover(short_ma, long_ma)
sell_signal = ta.crossunder(short_ma, long_ma)
// Plot the buy and sell signals with labels (white text)
plotshape(buy_signal, location=location.belowbar, color=color.green, style=shape.labelup, title="Buy Signal", text="BUY", textcolor=color.white)
plotshape(sell_signal, location=location.abovebar, color=color.red, style=shape.labeldown, title="Sell Signal", text="SELL", textcolor=color.white)
// Optional: Background color to highlight the signals
bgcolor(buy_signal ? color.new(color.green, 90) : na, title="Buy Signal Background")
bgcolor(sell_signal ? color.new(color.red, 90) : na, title="Sell Signal Background")
Açık kaynak kodlu komut dosyası
Gerçek TradingView ruhuna uygun olarak, bu komut dosyasının oluşturucusu bunu açık kaynaklı hale getirmiştir, böylece yatırımcılar betiğin işlevselliğini inceleyip doğrulayabilir. Yazara saygı! Ücretsiz olarak kullanabilirsiniz, ancak kodu yeniden yayınlamanın Site Kurallarımıza tabi olduğunu unutmayın.
Feragatname
Bilgiler ve yayınlar, TradingView tarafından sağlanan veya onaylanan finansal, yatırım, işlem veya diğer türden tavsiye veya tavsiyeler anlamına gelmez ve teşkil etmez. Kullanım Şartları'nda daha fazlasını okuyun.