OPEN-SOURCE SCRIPT
CCI + MACD Signal MTF (2nd-cross)
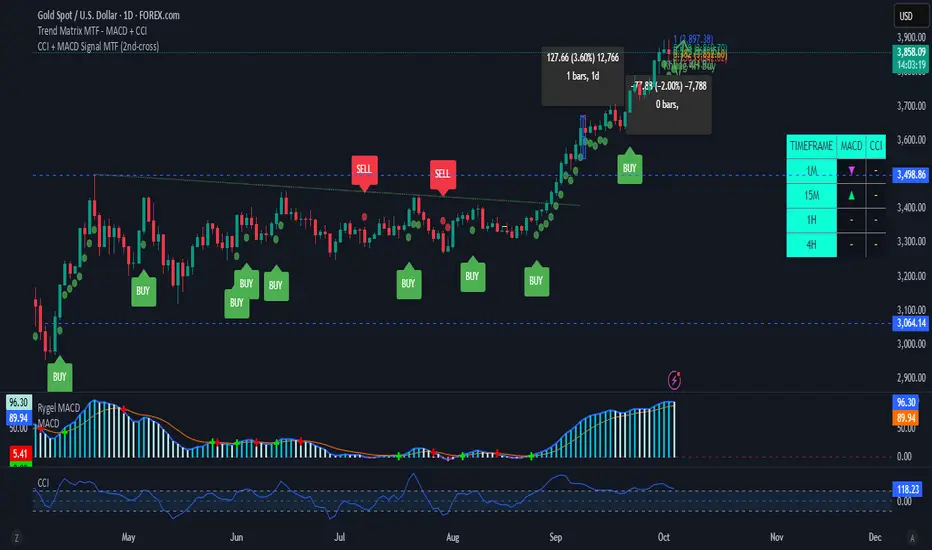
This custom indicator combines the Commodity Channel Index (CCI) and the MACD to generate trading signals.
Basic signals (dots):
A green dot is plotted when CCI is above +100 and MACD is positive.
A red dot is plotted when CCI is below –100 and MACD is negative.
These dots help visualize momentum alignment between the two indicators.
Second-cross signals (text + alert):
The indicator also tracks cycles of the CCI.
When CCI first moves above +100 and later falls back below +100, this is counted as one completed cycle.
The next time CCI crosses back above +100 (the second cross), if MACD is still positive, a “BUY” label is plotted and a buy alert is triggered.
Conversely, when CCI first moves below –100 and later rises back above –100, that is one completed cycle.
The next time CCI crosses back below –100 (the second cross), if MACD is negative, a “SELL” label is plotted and a sell alert is triggered.
Alerts:
Alerts are only fired on the second-cross events (BUY or SELL), making them rarer but potentially more reliable than the basic dot conditions.
Timeframe flexibility:
Both the CCI and the MACD can be calculated on custom timeframes independently of the chart’s timeframe.
Açık kaynak kodlu komut dosyası
Gerçek TradingView ruhuyla, bu komut dosyasının mimarı, yatırımcıların işlevselliğini inceleyip doğrulayabilmesi için onu açık kaynaklı hale getirdi. Yazarı tebrik ederiz! Ücretsiz olarak kullanabilseniz de, kodu yeniden yayınlamanın Topluluk Kurallarımıza tabi olduğunu unutmayın.
Feragatname
Bilgiler ve yayınlar, TradingView tarafından sağlanan veya onaylanan finansal, yatırım, alım satım veya diğer türden tavsiye veya öneriler anlamına gelmez ve teşkil etmez. Kullanım Koşulları bölümünde daha fazlasını okuyun.