OPEN-SOURCE SCRIPT
Güncellendi Z-Fusion Oscillator | Lyro RS
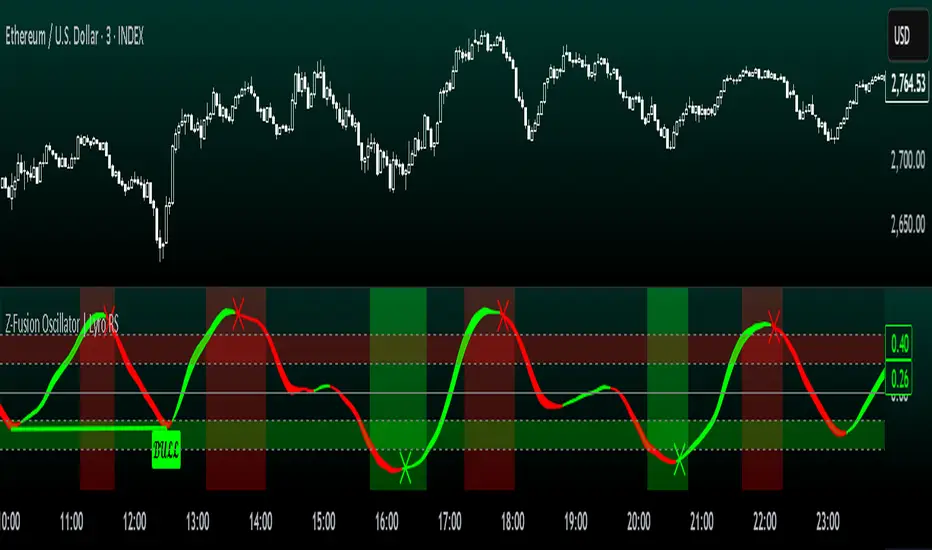
The Z-Fusion Oscillator converts five momentum indicators into Z-scores and blends them into one normalized signal that adapts across markets.
By combining normalization, smoothing, and divergence detection, users can easily identify when momentum is accelerating, weakening, reversing, or entering extreme zones
🔶 USAGE

The Z-Fusion Oscillator is designed to give traders a unified reading of market momentum—removing the noise of comparing tools that normally run on different scales.
By transforming RSI, MACD histogram, Stochastic, Momentum, and Rate of Change into Z-scores, this tool standardizes all inputs, making trend strength and shifts easier to interpret.
A dual-line system (fast Z-fusion line + slower baseline) highlights turning points, while overbought/oversold bands and “X-marks” help traders spot exhaustion and potential reversals.
🔹 Unified Momentum Structure
The indicator’s core strength comes from combining five Z-scored signals into one average.
Which makes momentum behavior more consistent across assets, reduces false extremes, and highlights true shifts in trend conviction.
🔹 Divergence Detection
The tool includes fully integrated divergence detection:
Bullish and bearish divergences are marked directly on the oscillator with labels and colored pivot connections, making hidden momentum shifts obvious.
🔹 Visual Extremes
Two sets of upper and lower Z-score thresholds help identify:
Background coloring reinforces when the oscillator moves beyond major levels, helping traders quickly assess momentum pressure.

🔹 Detecting Momentum Anomalies
Z-scores allow the oscillator to highlight when market momentum behaves abnormally relative to its own recent history.
For example:
This makes the Z-Fusion Oscillator particularly useful for spotting subtle shifts in trend direction that traditional indicators may miss.
🔶 DETAILS
🔹 Composite Z-Score Framework
Each momentum tool is smoothed, normalized, and transformed:
These are averaged into one composite Z-score to provide a consistent reading across assets and market conditions.
🔹 Fusion Trend Lines
Two lines serve as the core signal:
Crossovers between these lines highlight momentum shifts, while their color reflects trend bias.
🔹 Overbought/Oversold Zones
Two upper and two lower Z-score thresholds define “zones”:
Filled regions and background colors help visually confirm extreme conditions.
🔹 Pivot-Based Divergence Engine
The script includes filtered pivot detection with customizable look-backs and range limits to ensure divergences are meaningful, not noise-driven.
🔶 SETTINGS
🔶 SUMMARY
The Z-Fusion Oscillator combines multiple momentum signatures into a single normalized signal, enabling traders to:
Whether you're a swing trader, intraday analyst, or trend-reversal hunter, the Z-Fusion Oscillator provides a powerful and adaptive way to read momentum.
By combining normalization, smoothing, and divergence detection, users can easily identify when momentum is accelerating, weakening, reversing, or entering extreme zones
🔶 USAGE
The Z-Fusion Oscillator is designed to give traders a unified reading of market momentum—removing the noise of comparing tools that normally run on different scales.
By transforming RSI, MACD histogram, Stochastic, Momentum, and Rate of Change into Z-scores, this tool standardizes all inputs, making trend strength and shifts easier to interpret.
A dual-line system (fast Z-fusion line + slower baseline) highlights turning points, while overbought/oversold bands and “X-marks” help traders spot exhaustion and potential reversals.
🔹 Unified Momentum Structure
The indicator’s core strength comes from combining five Z-scored signals into one average.
Which makes momentum behavior more consistent across assets, reduces false extremes, and highlights true shifts in trend conviction.
🔹 Divergence Detection
The tool includes fully integrated divergence detection:
- Regular Bullish Divergence: Price makes a lower low while Z-Fusion forms a higher low.
- Regular Bearish Divergence: Price makes a higher high while Z-Fusion forms a lower high
Bullish and bearish divergences are marked directly on the oscillator with labels and colored pivot connections, making hidden momentum shifts obvious.
🔹 Visual Extremes
Two sets of upper and lower Z-score thresholds help identify:
- Extreme overbought surges
- Extreme oversold drops
- Reversal zones
- Potential exhaustion conditions
Background coloring reinforces when the oscillator moves beyond major levels, helping traders quickly assess momentum pressure.
🔹 Detecting Momentum Anomalies
Z-scores allow the oscillator to highlight when market momentum behaves abnormally relative to its own recent history.
For example:
- The oscillator reaching +1 or –1 after an extended trend may indicate a climax.
- A sharp Z-score reversal within an extreme zone can signal a trend exhaustion or a corrective move.
- Divergences often appear earlier due to normalization smoothing out indicator noise.
This makes the Z-Fusion Oscillator particularly useful for spotting subtle shifts in trend direction that traditional indicators may miss.
🔶 DETAILS
🔹 Composite Z-Score Framework
Each momentum tool is smoothed, normalized, and transformed:
- RSI → EMA-smoothed, Z-scored
- MACD histogram → Z-scored
- Stochastic → EMA + SMA smoothing, then Z-scored
- Momentum → EMA-smoothed, Z-scored
- Rate of Change → EMA-smoothed, Z-scored
These are averaged into one composite Z-score to provide a consistent reading across assets and market conditions.
🔹 Fusion Trend Lines
Two lines serve as the core signal:
- Fast Line (savg) – reacts quicker to trend changes
- Slow Line (savg2) – acts as a baseline filter
Crossovers between these lines highlight momentum shifts, while their color reflects trend bias.
🔹 Overbought/Oversold Zones
Two upper and two lower Z-score thresholds define “zones”:
- Upper zones highlight overheated momentum or potential bearish reversals
- Lower zones highlight depressed momentum or potential bullish reversals
Filled regions and background colors help visually confirm extreme conditions.
🔹 Pivot-Based Divergence Engine
The script includes filtered pivot detection with customizable look-backs and range limits to ensure divergences are meaningful, not noise-driven.
🔶 SETTINGS
🔹 Indicator Settings- Source — Price series used for all calculations.
- Z-Score Length — Lookback period for Z-score normalization.
- Z-Score MA Length — Smoothing length for the fusion signal lines.
- Overbought/Oversold Levels — Four customizable threshold lines.
- Color Palette — Choose from preset themes or define custom colors.
🔹 RSI - Length — RSI calculation period.
- EMA Smoothing Length — Smooths RSI before Z-score conversion.
🔹 MACD - Fast Length — Fast EMA length.
- Slow Length — Slow EMA length.
- Signal Line Length — MACD signal smoothing.
🔹 Stochastic - %K Length — Main stochastic length.
- EMA Smoothing — Smooths %K for stability.
- %D Length — Smoothing for the signal line.
🔹 Momentum - Length — Momentum lookback.
- EMA Smoothing — Smooths momentum before Z-scoring.
🔹 Rate of Change - Length — ROC lookback.
- EMA Smoothing — Smooths ROC values.
🔹 Divergence - Enable/Disable Divergence Detection — Toggle divergence engine.
- Pivot Left/Right Lookback — Defines pivot detection sensitivity.
- Detection Range Limits — Controls allowable range for divergence.
- Bull/Bear Colors & Styling — Customize divergence visualization.
🔶 SUMMARY
The Z-Fusion Oscillator combines multiple momentum signatures into a single normalized signal, enabling traders to:
- Identify reversals early
- Detect momentum exhaustion
- Spot bullish and bearish divergences
- Track overbought/oversold conditions
- Visualize trend strength with clarity
Whether you're a swing trader, intraday analyst, or trend-reversal hunter, the Z-Fusion Oscillator provides a powerful and adaptive way to read momentum.
Sürüm Notları
Update: ChartAçık kaynak kodlu komut dosyası
Gerçek TradingView ruhuyla, bu komut dosyasının mimarı, yatırımcıların işlevselliğini inceleyip doğrulayabilmesi için onu açık kaynaklı hale getirdi. Yazarı tebrik ederiz! Ücretsiz olarak kullanabilseniz de, kodu yeniden yayınlamanın Topluluk Kurallarımıza tabi olduğunu unutmayın.
Get access to our private indicators & analysis: whop.com/lyro-rs
Join our community: discord.gg/kcEBMWaFjS
All material from Lyro RS is for educational purposes only. Past performance does not guarantee future results.
Join our community: discord.gg/kcEBMWaFjS
All material from Lyro RS is for educational purposes only. Past performance does not guarantee future results.
Feragatname
Bilgiler ve yayınlar, TradingView tarafından sağlanan veya onaylanan finansal, yatırım, alım satım veya diğer türden tavsiye veya öneriler anlamına gelmez ve teşkil etmez. Kullanım Koşulları bölümünde daha fazlasını okuyun.
Açık kaynak kodlu komut dosyası
Gerçek TradingView ruhuyla, bu komut dosyasının mimarı, yatırımcıların işlevselliğini inceleyip doğrulayabilmesi için onu açık kaynaklı hale getirdi. Yazarı tebrik ederiz! Ücretsiz olarak kullanabilseniz de, kodu yeniden yayınlamanın Topluluk Kurallarımıza tabi olduğunu unutmayın.
Get access to our private indicators & analysis: whop.com/lyro-rs
Join our community: discord.gg/kcEBMWaFjS
All material from Lyro RS is for educational purposes only. Past performance does not guarantee future results.
Join our community: discord.gg/kcEBMWaFjS
All material from Lyro RS is for educational purposes only. Past performance does not guarantee future results.
Feragatname
Bilgiler ve yayınlar, TradingView tarafından sağlanan veya onaylanan finansal, yatırım, alım satım veya diğer türden tavsiye veya öneriler anlamına gelmez ve teşkil etmez. Kullanım Koşulları bölümünde daha fazlasını okuyun.