OPEN-SOURCE SCRIPT
Güncellendi Price and Longitude Angles
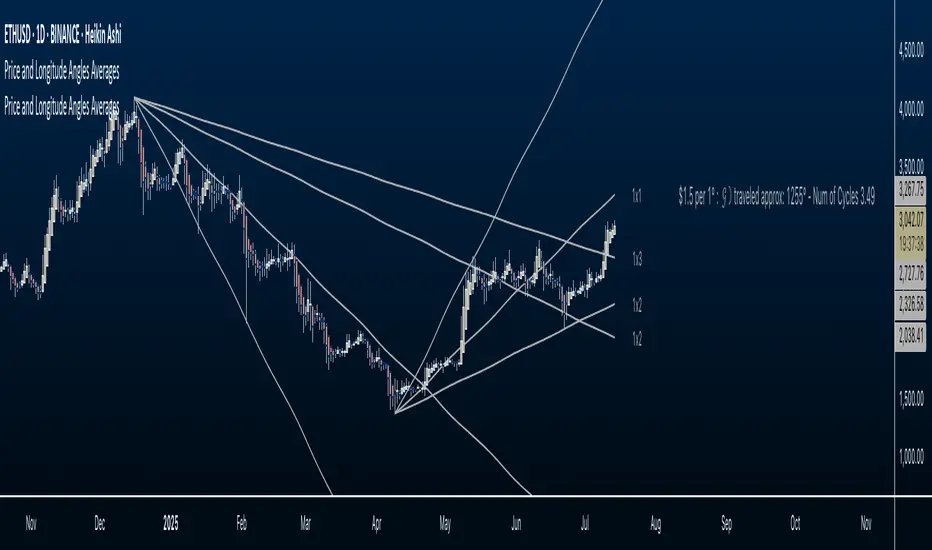
Planetary Price & Longitude Angles Indicator
This indicator plots planetary price and longitude angles starting from a user-selected date and time, offering a distinctive lens to explore the relationship between price and planetary timing. It supports both heliocentric and geocentric, enabling flexible and in-depth planetary analysis. The angles can be plotted across any time frame for maximum versatility.
How to Use
Once the indicator is loaded, you’ll be prompted to select a starting date and time for your analysis. From there, customize it as follows:
Select Planetary Options:
To plot the price and longitude for a single planet, choose the same planet in both dropdown menus.
To plot the average of two planets, select a different planet in each dropdown.
Set the Price Per Degree of Longitude: Adjust this value to define the scaling of the planetary angles relative to price.
Customize Fan Settings:
Toggle the mirroring of the fan on or off based on your needs.
Show or hide specific angle divisions to tailor the display to your preferences.
Display or conceal the information label that indicates the price per longitude and the number of degrees traveled.
[Acknowledgments, Inspiration & Disclaimer]
This indicator is inspired by the methodologies of W.D. Gann and Patrick Mikula, expanding on concepts from Gann Scientific Method Unveiled, Volume 2. It was built using Astrolib by BarefootJoey
I crafted this tool through dedication to support my own study of these ideas. I’m sharing it open-source not only to deepen my understanding and honor the work of Gann and Mikula, but also to invite collaboration. There’s always room for improvement—whether in functionality, accuracy, or design—and I hope others will join me in refining it. This is for those like me: eager to explore these concepts but lacking tools to experiment with. Let’s build on it together.
Sürüm Notları
Improvement: added alerts for Planetary Angles Sürüm Notları
🚀 Release Notes: [Version 2.0]🔐 Licensing Updates
Switched to a dual-licensing model:
Original work is now licensed under CC BY-NC-SA 4.0 (no commercial use, attribution required, must share alike).
AstroLib, BarefootJoey’s code, and HSV/HSL Color Tools by kaigouthro remain under MPL-2.0 for full compliance.
Clarified third-party contributions and ensured compliance with all licensing terms.
🎨 Feature Enhancements
Added HSV coloring from kaigouthro for improved color.
Implemented Heliocentric & Geocentric labeling, allowing users to distinguish planetary coordinate systems on the main label info.
Added optional bar coloring to visually represent underlying planetary longitude, making it easier to spot trends and correlations.
🐞 Fixes & Improvements
Fixed label placements to prevent incorrect or unwanted pivot labels appearing at dateTime.
Refined planetary calculations for smoother data handling and accuracy.
Sürüm Notları
Release Notes — Zodiac Degree Hue Table• Zodiac signs shown once per 30° sector to reduce visual clutter.
• Added left-facing triangle (◀) to dynamically point to the planetary AVG longitude position.
• Color bands mapped using HSV hue logic (via hsvColor library) for full visual consistency.
• New UI settings: Toggle color table visibility and text color styling for cleaner display control.
Sürüm Notları
Fixed low priority bug where disabling the 1x1 Price & Longitude angle also removed the orbital hue bar coloring. Orbital hue is now fully independent of angle visibility.Sürüm Notları
This update introduces two major enhancements designed to deepen the spatial and relational understanding of celestial motion in market analysis.1. Longitude Relationship Table
A new Longitude Relationship Table has been added to help visualize and interpret angular relationships (☌ □ △ ☍ ✶) "Lambert Gann Symbol" from any point in the zodiac using a framework originally introduced by Patrick Mikula in Gann’s Scientific Methods Unveiled – Volume 1.
• ⚓ Anchor Icon: When you anchor the Price & Longitude Angle from any bar (e.g., a significant high or low), the corresponding zodiac sign is highlighted on the left of the table.
• ▶ White Pointer: As price bars unfold, a live pointer moves through the zodiac, showing the current position of the tracked celestial body (or average of two, if enabled).
• Tooltips: Hover over the anchor icon to view the exact zodiac degree.
• Read Horizontally: From the Start Column pick any row, move across the table to instantly interpret current angular relationships — square, trine, opposition, and sextiles — as the white pointer moves.
This tool allows for real-time contextual awareness of angular relationships as they form in motion.
⸻
2. Color System Overhaul
The visual color scheme has been refined for clarity and rhythm:
• The number of hues has been reduced by half, replacing fine gradients with stronger per-sign contrasts.
• Special care was given to signs with close hue proximity (e.g. Cancer → Leo → Virgo, Pisces ↔ Aries) to ensure transitions are now more visible and intuitive.
• The result is a cleaner, rhythmically colored price chart and best experienced using white bar candles.
⸻
Looking Ahead: Open-Source Color Framework
The color system introduced here will soon be released as its own open-source indicator — a lightweight utility for tracking planetary position, sign ingress, and hue-coded transitions independently of any price overlay.
This visual system is my own contribution. While Mikula/Gann laid the foundation for the relational geometry, the color system brings it into new light allowing traders and analysts to see the dynamics of celestial motion through the zodiac.
Sürüm Notları
Release Notes:Removed deprecated X handle from the script title to meet platform rules.
Enhanced label display with optional cycle tracking from selected anchor.
– Cycle unit is user-defined (default: 360°)
– Number of full cycles (plus fractional progress) is now appended directly to the main label
Açık kaynak kodlu komut dosyası
Gerçek TradingView ruhuyla, bu komut dosyasının mimarı, yatırımcıların işlevselliğini inceleyip doğrulayabilmesi için onu açık kaynaklı hale getirdi. Yazarı tebrik ederiz! Ücretsiz olarak kullanabilseniz de, kodu yeniden yayınlamanın Topluluk Kurallarımıza tabi olduğunu unutmayın.
© 2025 Blueprint Research LLC · CC BY-NC-SA 4.0
Feragatname
Bilgiler ve yayınlar, TradingView tarafından sağlanan veya onaylanan finansal, yatırım, alım satım veya diğer türden tavsiye veya öneriler anlamına gelmez ve teşkil etmez. Kullanım Koşulları bölümünde daha fazlasını okuyun.