OPEN-SOURCE SCRIPT
Indicator: Vervoort Smoothed Oscillator [LazyBear]
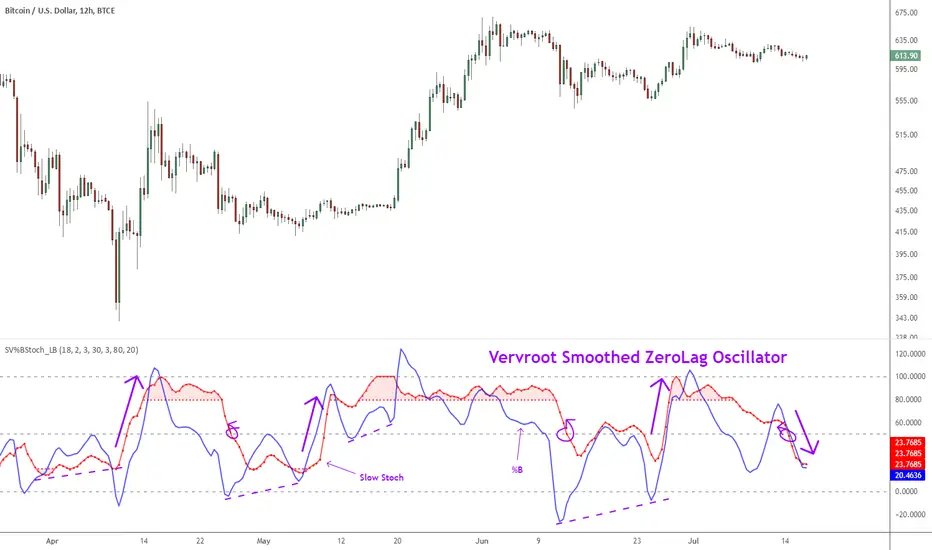
This is Mr. Sylvian Vervoort's take on improving some well-known indicators (%B and Stoch) using smoothing techniques. A combination of TEMA and WMA does a nice job smoothing out %B, derived from zero-lag “Rainbow” data series. The same Rainbow series, averaged with the typical price, smooth the Stochastic K oscillator to produce slowStoch.
Vervroot's strategy for this oscillator (detailed explanation in the reference material below):
- It must be bullish for a buy signal and bearish for a sell signal. This means that both the oscillators must be moving up or down.
- Use the oscillators for detecting divergences. Divergence even in one is still valid.
- Stoch crossing 50 is a good confirmation signal. Momentum usually is an excellent leading indicator, so keep an eye on Stoch.
More info:
traders.com/Documentation/FEEDbk_docs/2013/09/Vervoort.html
scribd.com/doc/182736057/2013SEP-pdf
Complete list of my indicators (Check the comments, I keep the list updated there):
tradingview.com/v/4IneGo8h/
Açık kaynak kodlu komut dosyası
Gerçek TradingView ruhuna uygun olarak, bu komut dosyasının oluşturucusu bunu açık kaynaklı hale getirmiştir, böylece yatırımcılar betiğin işlevselliğini inceleyip doğrulayabilir. Yazara saygı! Ücretsiz olarak kullanabilirsiniz, ancak kodu yeniden yayınlamanın Site Kurallarımıza tabi olduğunu unutmayın.
List of my free indicators: bit.ly/1LQaPK8
List of my indicators at Appstore: blog.tradingview.com/?p=970
List of my indicators at Appstore: blog.tradingview.com/?p=970
Feragatname
Bilgiler ve yayınlar, TradingView tarafından sağlanan veya onaylanan finansal, yatırım, işlem veya diğer türden tavsiye veya tavsiyeler anlamına gelmez ve teşkil etmez. Kullanım Şartları'nda daha fazlasını okuyun.