PROTECTED SOURCE SCRIPT
BLACK MAGIC RSI
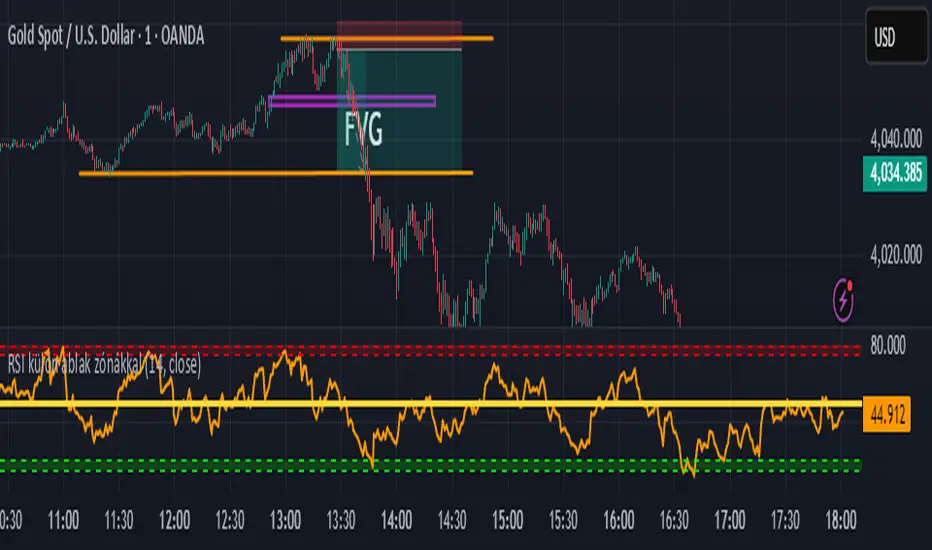
What Is the RSI?
The Relative Strength Index (RSI) is a momentum indicator used in technical analysis to measure the speed and strength of recent price movements. It was developed by J. Welles Wilder Jr. and is one of the most popular tools for identifying whether an asset is overbought or oversold.
🔹 How It Works
The RSI moves on a scale from 0 to 100 and compares the size of recent gains to recent losses.
When the RSI value is high, it means prices have risen quickly.
When the RSI value is low, it means prices have fallen sharply.
Korumalı komut dosyası
Bu komut dosyası kapalı kaynak olarak yayınlanmaktadır. Ancak, ücretsiz ve herhangi bir sınırlama olmaksızın kullanabilirsiniz – daha fazla bilgiyi buradan edinebilirsiniz.
Feragatname
Bilgiler ve yayınlar, TradingView tarafından sağlanan veya onaylanan finansal, yatırım, alım satım veya diğer türden tavsiye veya öneriler anlamına gelmez ve teşkil etmez. Kullanım Koşulları bölümünde daha fazlasını okuyun.