OPEN-SOURCE SCRIPT
Simplified STH-MVRV + Z-Score
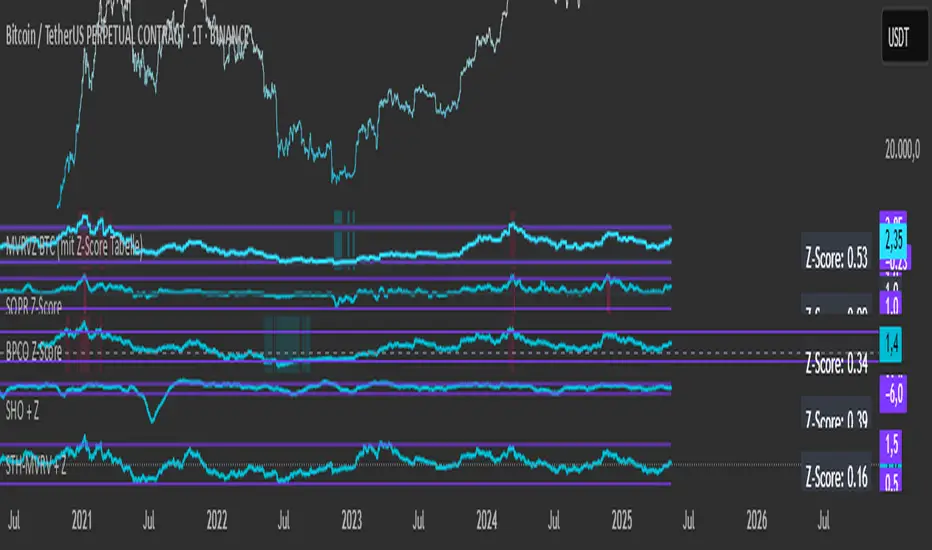
Simplified Short Term Holder MVRV (STH-MVRV) + Z-Score Indicator
Description:
This indicator visualizes the Short Term Holder Market Value to Realized Value ratio (STH-MVRV) and its normalized Z-Score, providing insight into Bitcoin’s market cycle phases and potential overbought or oversold conditions.
How it works:
The STH-MVRV ratio compares the market value of coins held by short-term holders to their realized value, helping to identify periods of profit-taking or accumulation by these holders.
The indicator calculates three versions:
STH-MVRV (MVRV): Ratio of current MVRV to its 155-day SMA.
STH-MVRV (Price): Ratio of BTC price to its 155-day SMA.
STH-MVRV (AVG): Average of the above two ratios.
You can select which ratio to display via the input dropdown.
Threshold Lines:
Adjustable upper and lower threshold lines mark significant levels where market sentiment might shift.
The indicator also plots a baseline at 1.0 as a reference.
Z-Score Explanation:
The Z-Score is a normalized value scaled between -3 and +3, calculated relative to the chosen threshold levels.
When the ratio hits the upper threshold, the Z-Score approaches +2, indicating potential overbought conditions.
Conversely, reaching the lower threshold corresponds to a Z-Score near -2, signaling potential oversold conditions.
This Z-Score is shown in a clear table in the top right corner of the chart for easy monitoring.
Data Sources:
MVRV data is fetched from the BTC_MVRV dataset.
Price data is sourced from the BTC/USD index.
Usage:
Use this indicator to assess short-term holder market behavior and to help identify buying or selling opportunities based on extremes indicated by the Z-Score.
Combining this tool with other analysis can improve timing decisions in Bitcoin trading.
Açık kaynak kodlu komut dosyası
Gerçek TradingView ruhuyla, bu komut dosyasının mimarı, yatırımcıların işlevselliğini inceleyip doğrulayabilmesi için onu açık kaynaklı hale getirdi. Yazarı tebrik ederiz! Ücretsiz olarak kullanabilseniz de, kodu yeniden yayınlamanın Topluluk Kurallarımıza tabi olduğunu unutmayın.
Feragatname
Bilgiler ve yayınlar, TradingView tarafından sağlanan veya onaylanan finansal, yatırım, alım satım veya diğer türden tavsiye veya öneriler anlamına gelmez ve teşkil etmez. Kullanım Koşulları bölümünde daha fazlasını okuyun.