OPEN-SOURCE SCRIPT
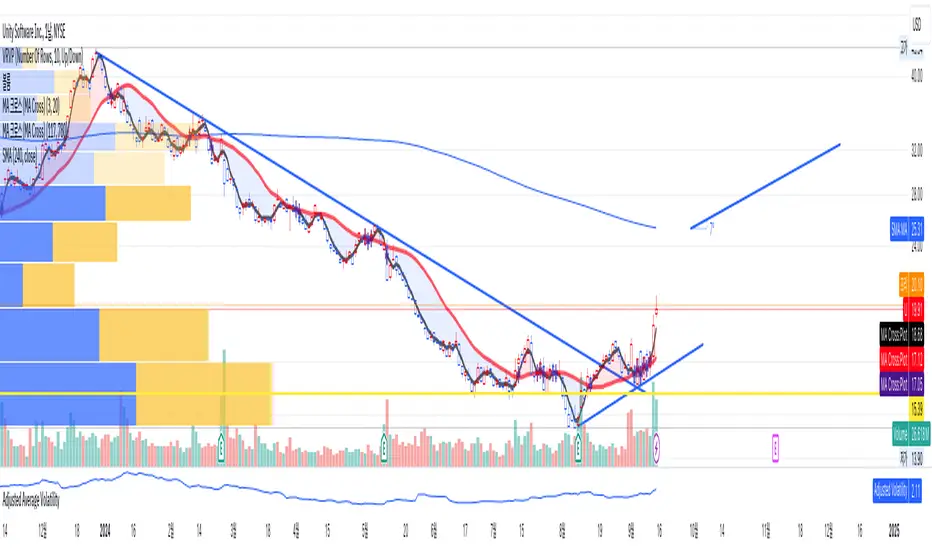
Adjusted Average Volatility

This Pine Script calculates the average volatility over the past 20 bars by taking the difference between the high and low prices. It then adjusts this volatility based on the previous closing price: if the price is below $20, the volatility is multiplied by 2, and if it’s above $20, the volatility is multiplied by 1.5. The adjusted volatility is then plotted on the chart, helping traders visualize how volatility changes relative to the asset's price level.
Açık kaynak kodlu komut dosyası
Gerçek TradingView ruhuyla, bu komut dosyasının mimarı, yatırımcıların işlevselliğini inceleyip doğrulayabilmesi için onu açık kaynaklı hale getirdi. Yazarı tebrik ederiz! Ücretsiz olarak kullanabilseniz de, kodu yeniden yayınlamanın Topluluk Kurallarımıza tabi olduğunu unutmayın.
Feragatname
Bilgiler ve yayınlar, TradingView tarafından sağlanan veya onaylanan finansal, yatırım, alım satım veya diğer türden tavsiye veya öneriler anlamına gelmez ve teşkil etmez. Kullanım Koşulları bölümünde daha fazlasını okuyun.