OPEN-SOURCE SCRIPT
CMP vs ATH Percentage
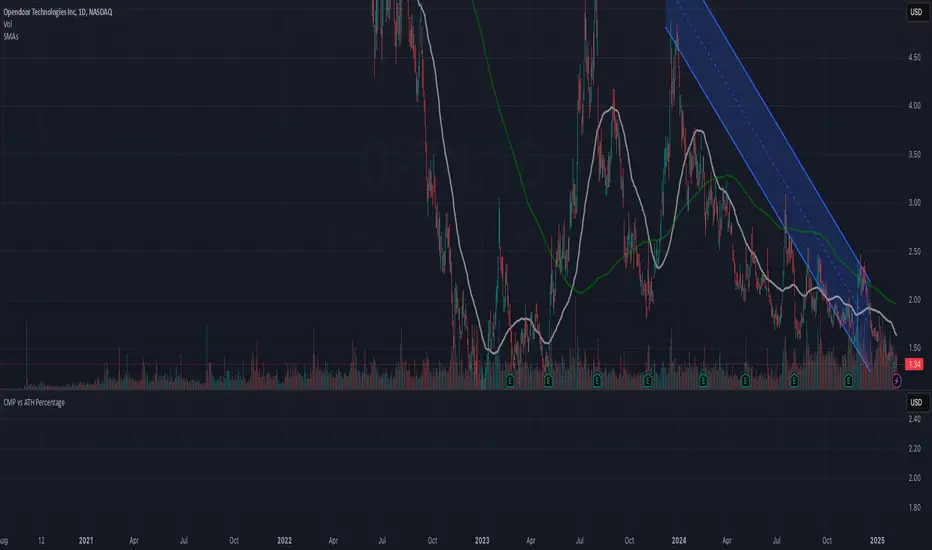
This indicator helps traders and investors track how the current market price (CMP) compares to the all-time high (ATH) price of an asset. It calculates the percentage difference between the CMP and ATH and displays it visually on the chart. A label is placed on the latest bar, showing key information like:
ATH (All-Time High Price)
CMP (Current Market Price)
Percentage Comparison (CMP as a percentage of ATH)
Additionally, the indicator plots a horizontal line at the ATH level to provide a clear visual reference for the price history.
Use Cases:
Identify price levels relative to historical highs.
Gauge whether the price is nearing or far from its ATH.
Quickly assess how much the price has recovered or declined from the ATH.
Customization:
You can modify the label's style, color, or text formatting according to your preferences. This indicator is useful for long-term analysis, especially when tracking stocks, indices, or other financial instruments on a weekly timeframe.
Note:
This indicator is designed to work on higher timeframes (e.g., daily or weekly) where ATH levels are more meaningful.
Açık kaynak kodlu komut dosyası
Gerçek TradingView ruhuyla, bu komut dosyasının mimarı, yatırımcıların işlevselliğini inceleyip doğrulayabilmesi için onu açık kaynaklı hale getirdi. Yazarı tebrik ederiz! Ücretsiz olarak kullanabilseniz de, kodu yeniden yayınlamanın Topluluk Kurallarımıza tabi olduğunu unutmayın.
Feragatname
Bilgiler ve yayınlar, TradingView tarafından sağlanan veya onaylanan finansal, yatırım, alım satım veya diğer türden tavsiye veya öneriler anlamına gelmez ve teşkil etmez. Kullanım Koşulları bölümünde daha fazlasını okuyun.