OPEN-SOURCE SCRIPT
Ehlers Instantaneous Trend [LazyBear]
One more to add to the Ehlers collection.
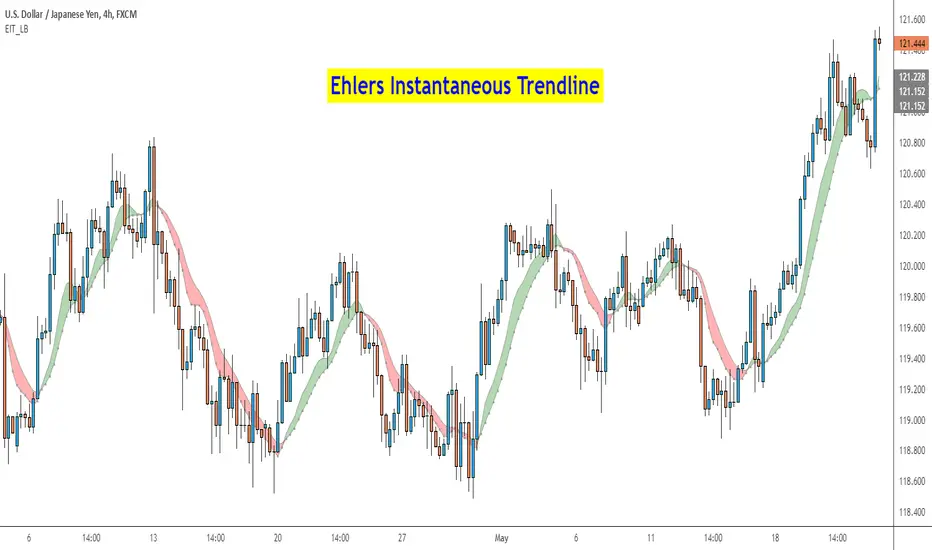
Ehlers Instantaneous Trendline, by John Ehlers, identifies the market trend by doing removing cycle component. I think, this simplicity is what makes it attractive :) To understand Ehlers's thought process behind this, refer to the PDF linked below.
There are atleast 6 variations of this ITrend. This version is from his early presentations.
Is this better than a simple HMA? May be, May be not. I will leave it to you to decide :)
I have added options to show this as a ribbon, and to color bars based on ITrend. Check out the options page.
More info:
- ITrend: mesasoftware.com/seminars/AfTAMay2003.pdf
List of my public indicators: bit.ly/1LQaPK8
List of my app-store indicators: blog.tradingview.com/?p=970
Açık kaynak kodlu komut dosyası
Gerçek TradingView ruhuna uygun olarak, bu komut dosyasının oluşturucusu bunu açık kaynaklı hale getirmiştir, böylece yatırımcılar betiğin işlevselliğini inceleyip doğrulayabilir. Yazara saygı! Ücretsiz olarak kullanabilirsiniz, ancak kodu yeniden yayınlamanın Site Kurallarımıza tabi olduğunu unutmayın.
List of my free indicators: bit.ly/1LQaPK8
List of my indicators at Appstore: blog.tradingview.com/?p=970
List of my indicators at Appstore: blog.tradingview.com/?p=970
Feragatname
Bilgiler ve yayınlar, TradingView tarafından sağlanan veya onaylanan finansal, yatırım, işlem veya diğer türden tavsiye veya tavsiyeler anlamına gelmez ve teşkil etmez. Kullanım Şartları'nda daha fazlasını okuyun.