OPEN-SOURCE SCRIPT
True Range Momentum
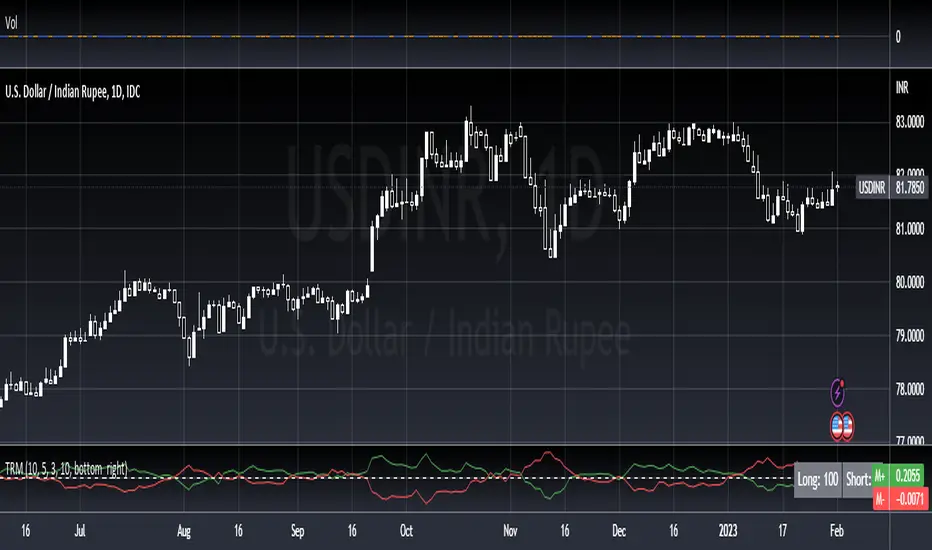
The indicator calculates the momentum of bullish and bearish based on the average true range and the highest highs and lowest lows of the historical price.
The indicator displays the strength for either taking a long position, or a short position.
The simplest way to use the indicator is to take a long position when the M+ line crosses above the 0 line. Similarly, to short, the M- line should cross above the 0 line. The exit would be when the respective line crosses below the 0 line.
The contrarian traders should wait for the lines to start rising towards the 0 line and taking an exit. In essence, the line should be going from negative to 0.
The greater the divergence between the M+ and M-, the stronger the trend.
The small table of Long and Short suggests what is in strength. A 100 will show a strong trend in the respective direction. It will be 50-50 when there is no clear direction, ideally identifying a consolidation range.
Açık kaynak kodlu komut dosyası
Gerçek TradingView ruhuyla, bu komut dosyasının mimarı, yatırımcıların işlevselliğini inceleyip doğrulayabilmesi için onu açık kaynaklı hale getirdi. Yazarı tebrik ederiz! Ücretsiz olarak kullanabilseniz de, kodu yeniden yayınlamanın Topluluk Kurallarımıza tabi olduğunu unutmayın.
Feragatname
Bilgiler ve yayınlar, TradingView tarafından sağlanan veya onaylanan finansal, yatırım, alım satım veya diğer türden tavsiye veya öneriler anlamına gelmez ve teşkil etmez. Kullanım Koşulları bölümünde daha fazlasını okuyun.