OPEN-SOURCE SCRIPT
Standard deviation channel of linear regression distance [AbAh]
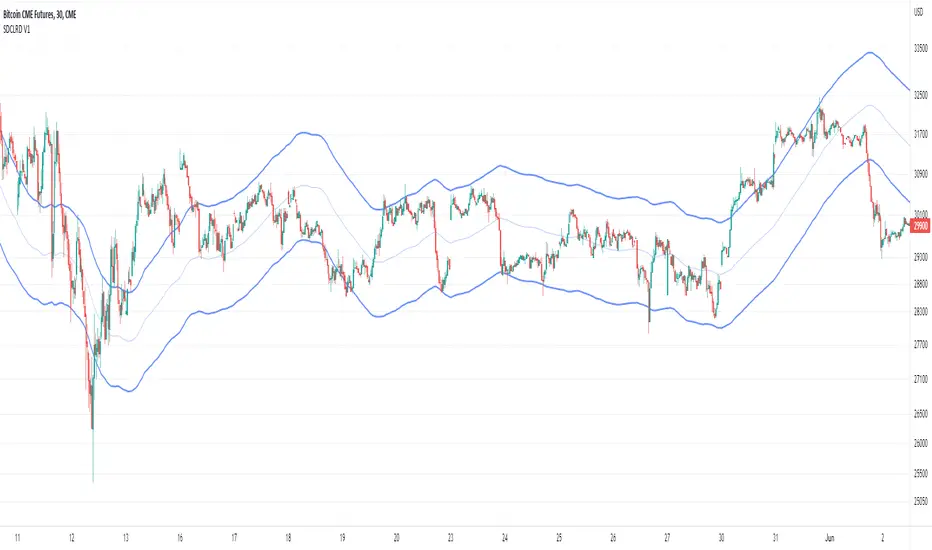
The indicator calculates the distance between linear regression line and the data point (price) as a percentage , then calculates the standard deviation for the linear regression distance , then draw the channel of two lines depending on the values of standard deviation .
///////// How to use ////////////////
1 - for Best result , indicator should be used on 2H frame Time of less : like 1H or 30 min
2 - The upper line and the lower line, both play a role as a support and resistance area, when the price bounces from the upper zone or lower zone, there is a high probability that it will move to the other line.
3 - The price breakout of one of the lower or upper lines may indicate a major price movement coming in the direction of the breakout
/////////////////////////////////////
Açık kaynak kodlu komut dosyası
Gerçek TradingView ruhuna uygun olarak, bu komut dosyasının oluşturucusu bunu açık kaynaklı hale getirmiştir, böylece yatırımcılar betiğin işlevselliğini inceleyip doğrulayabilir. Yazara saygı! Ücretsiz olarak kullanabilirsiniz, ancak kodu yeniden yayınlamanın Site Kurallarımıza tabi olduğunu unutmayın.
Feragatname
Bilgiler ve yayınlar, TradingView tarafından sağlanan veya onaylanan finansal, yatırım, işlem veya diğer türden tavsiye veya tavsiyeler anlamına gelmez ve teşkil etmez. Kullanım Şartları'nda daha fazlasını okuyun.