OPEN-SOURCE SCRIPT
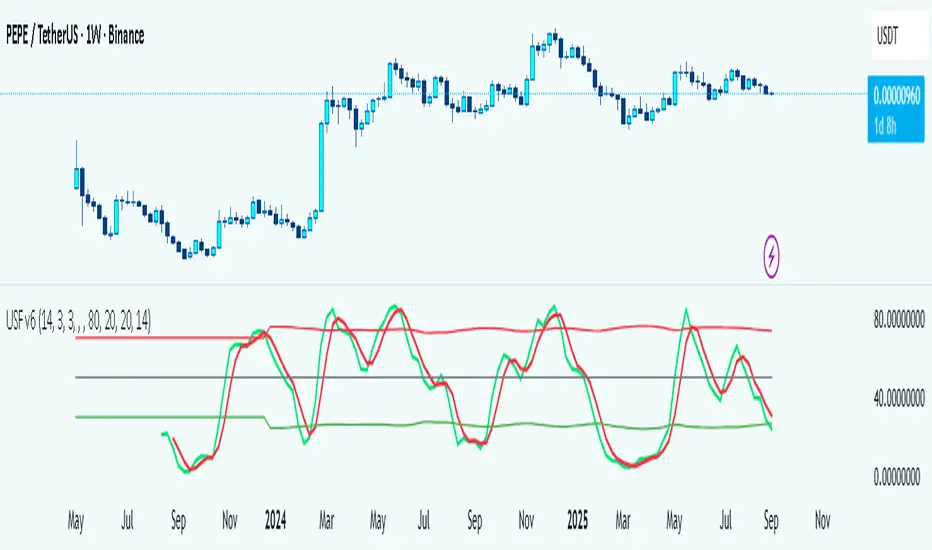
Universal Stochastic Fusion (Simplified) — v6
What this indicator is
This indicator is called Universal Stochastic Fusion (USF).
It’s a tool that helps traders see when the market might be too high (overbought) or too low (oversold), and when it might be a good time to buy or sell.
________________________________________
How it works
Think of the market like a rubber band.
• If the band stretches too far up, it usually snaps back down.
• If it stretches too far down, it usually bounces back up.
The USF indicator measures this stretch using something called the Stochastic Oscillator (just a fancy way of saying it looks at where the current price sits compared to recent highs and lows).
It shows this on a scale from 0 to 100:
• Near 100 → market is stretched upward (too hot).
• Near 0 → market is stretched downward (too cold).
• Around 50 → normal, middle ground.
________________________________________
What’s special about USF
1. Two views at once
o It lets you see the market’s stretch on your current chart and on another timeframe (like a daily view).
o This way, you can see the short-term and the bigger picture together.
2. Smart levels
o Instead of always using the same “too high/too low” levels (like 80 and 20), it can adjust these lines automatically depending on how wild or calm the market is.
3. Buy and Sell signals
o When the market looks too low and starts turning up, it can mark a BUY.
o When the market looks too high and starts turning down, it can mark a SELL.
4. Extra filter (optional)
o It can also use another tool (RSI) to double-check signals, so you don’t get as many false alerts.
________________________________________
How this helps traders
• It helps traders avoid buying when prices are already too high.
• It helps them spot possible bottoms where prices may bounce back.
• It combines short-term and long-term signals so traders don’t get tricked by quick moves.
________________________________________
Where it works
This indicator is universal — meaning it works on almost any market:
• Stocks (like Apple, Tesla, etc.)
• Forex (currencies like EUR/USD)
• Crypto (Bitcoin, Ethereum, etc.)
• Commodities (Gold, Oil, etc.)
• Futures and Indices (S&P 500, Nasdaq, etc.)
Because all these markets share the same pattern of prices going up and down too much and then pulling back, the USF can be applied everywhere.
________________________________________
👉 In short:
The Universal Stochastic Fusion is like a heat meter for the market.
It tells you when prices might be too hot (good chance to sell) or too cold (good chance to buy), and it works in all markets and timeframes.
________________________________________
Açık kaynak kodlu komut dosyası
Gerçek TradingView ruhuyla, bu komut dosyasının mimarı, yatırımcıların işlevselliğini inceleyip doğrulayabilmesi için onu açık kaynaklı hale getirdi. Yazarı tebrik ederiz! Ücretsiz olarak kullanabilseniz de, kodu yeniden yayınlamanın Topluluk Kurallarımıza tabi olduğunu unutmayın.
Trade forex, indices, stocks and metals with up to US$100.000 in company's funding.
Complete a challenge to access funding or go for instant deposit.
Trading involves substantial risk. Not financial advice
Complete a challenge to access funding or go for instant deposit.
Trading involves substantial risk. Not financial advice
Feragatname
Bilgiler ve yayınlar, TradingView tarafından sağlanan veya onaylanan finansal, yatırım, alım satım veya diğer türden tavsiye veya öneriler anlamına gelmez ve teşkil etmez. Kullanım Koşulları bölümünde daha fazlasını okuyun.