Yearly Levels for Day Traders
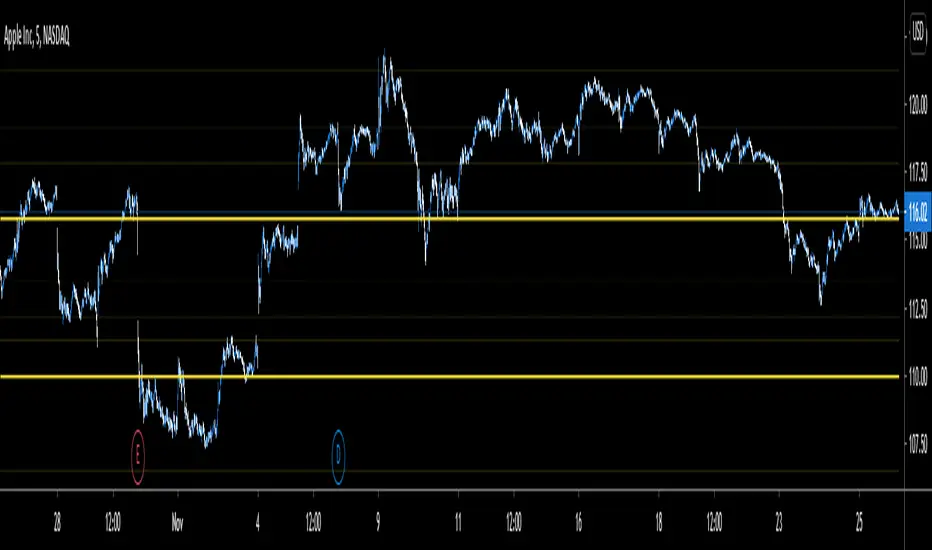
The script is useful in identifying price levels for the short term trading. The inputs are based on Fibonacci ratios but on yearly basis.
You will need to enter the pair ratio for where the stock is between ( I will show you).
Those pairs are as follows:
R1/R2
(0/0.23)
(.23/.38)
(.38/.61)
(.61/1)
(1/1.61)
(1.61/2.61)
(2.61/4.23)
(4.23/6.859)
(6.85/11.08)
(11.08/17.94)
(17.94/29.05)
(29.05/46.95)
(46.95/75.99)
(75.99/122.99)
I personally added the indicator multiple times to a template and put in all the pairs so I do not have to enter the pair each time.
The script does not tell you which level is a bottom or a top. Your experience matters.
If you are interested please PM me the username:
Yalnızca davetli komut dosyası
Bu komut dosyasına yalnızca yazar tarafından yetkilendirilen kullanıcılar erişebilir ve bu genellikle ödeme gerektirir. Bu komut dosyasını favorilerinize ekleyebilirsiniz, ancak yalnızca yazarından izin istedikten ve aldıktan sonra kullanabilirsiniz — daha fazla bilgi burada. Daha fazla ayrıntı için yazarın aşağıdaki talimatlarını izleyin veya doğrudan malrawi ile iletişime geçin.
TradingView, yazarına tam olarak güvenmediğiniz ve nasıl çalıştığını anlamadığınız sürece bir komut dosyası için ödeme yapmanızı veya kullanmanızı ÖNERMEZ. Ayrıca topluluk komut dosyaları bölümümüzde ücretsiz, açık kaynaklı alternatifler bulabilirsiniz.
Yazarın talimatları
Uyarı: Erişim talebinde bulunmadan önce lütfen yalnızca davetli komut dosyaları kılavuzumuzu okuyun.
Feragatname
Yalnızca davetli komut dosyası
Bu komut dosyasına yalnızca yazar tarafından yetkilendirilen kullanıcılar erişebilir ve bu genellikle ödeme gerektirir. Bu komut dosyasını favorilerinize ekleyebilirsiniz, ancak yalnızca yazarından izin istedikten ve aldıktan sonra kullanabilirsiniz — daha fazla bilgi burada. Daha fazla ayrıntı için yazarın aşağıdaki talimatlarını izleyin veya doğrudan malrawi ile iletişime geçin.
TradingView, yazarına tam olarak güvenmediğiniz ve nasıl çalıştığını anlamadığınız sürece bir komut dosyası için ödeme yapmanızı veya kullanmanızı ÖNERMEZ. Ayrıca topluluk komut dosyaları bölümümüzde ücretsiz, açık kaynaklı alternatifler bulabilirsiniz.
Yazarın talimatları
Uyarı: Erişim talebinde bulunmadan önce lütfen yalnızca davetli komut dosyaları kılavuzumuzu okuyun.