OPEN-SOURCE SCRIPT
Güncellendi Price × Volume Table
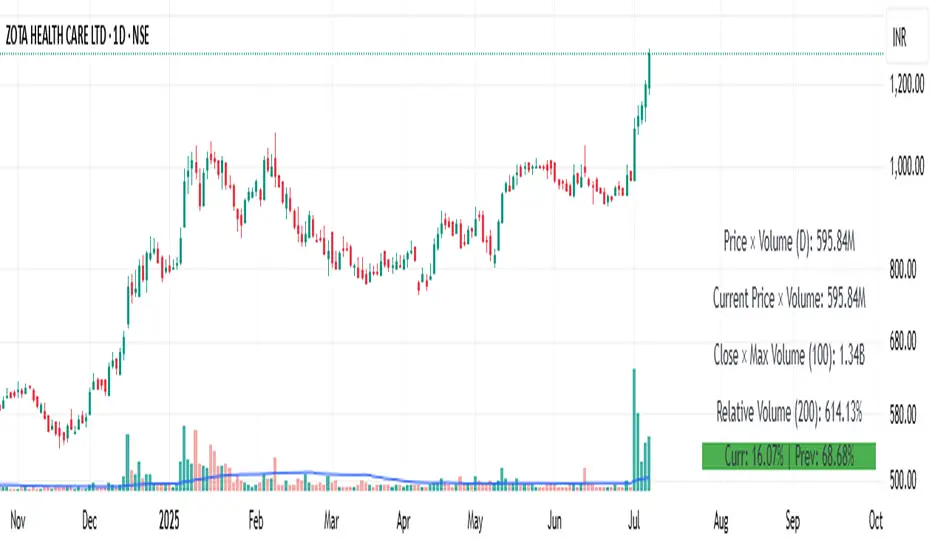
It creates a table showing:
1- Daily Close × Daily Volume
2- Current Close × Current Volume
3- Close × Highest Volume (last 360 candles)
1- Daily Close × Daily Volume
2- Current Close × Current Volume
3- Close × Highest Volume (last 360 candles)
Sürüm Notları
This indicator displays a real-time table showing important volume and liquidity metrics to help traders assess market activity at a glance.Included Metrics:
Price × Volume (1D): Daily closing price × volume from the selected higher timeframe (default: 1D).
Current Price × Volume: Live price × volume for the current bar.
Close × Max Volume (Lookback): Current close multiplied by the highest volume observed over a user-defined lookback period (default: 360 candles).
Relative Volume (RVOL %): Compares current volume with its moving average (default MA: 200) and shows the result as a percentage.
User Settings:
Toggle any of the 4 rows on/off
Customize the moving average length for RVOL
Choose the lookback period for highest volume
Select the timeframe for daily data
Use Case:
This tool helps traders:
Spot volume anomalies
Gauge institutional interest via RVOL
Identify high-liquidity conditions for entries/exits
Notes:
Table is positioned in the bottom-right corner
All values are auto-formatted (e.g., 1.5M, 3.2B)
Compatible with all instruments and timeframes
Sürüm Notları
Feature Added:- 1- Current candle volume change
2- Previous candle Volume change
Açık kaynak kodlu komut dosyası
Gerçek TradingView ruhuyla, bu komut dosyasının mimarı, yatırımcıların işlevselliğini inceleyip doğrulayabilmesi için onu açık kaynaklı hale getirdi. Yazarı tebrik ederiz! Ücretsiz olarak kullanabilseniz de, kodu yeniden yayınlamanın Topluluk Kurallarımıza tabi olduğunu unutmayın.
Feragatname
Bilgiler ve yayınlar, TradingView tarafından sağlanan veya onaylanan finansal, yatırım, alım satım veya diğer türden tavsiye veya öneriler anlamına gelmez ve teşkil etmez. Kullanım Koşulları bölümünde daha fazlasını okuyun.