OPEN-SOURCE SCRIPT
Güncellendi [JHF] Asset Performance Ratio
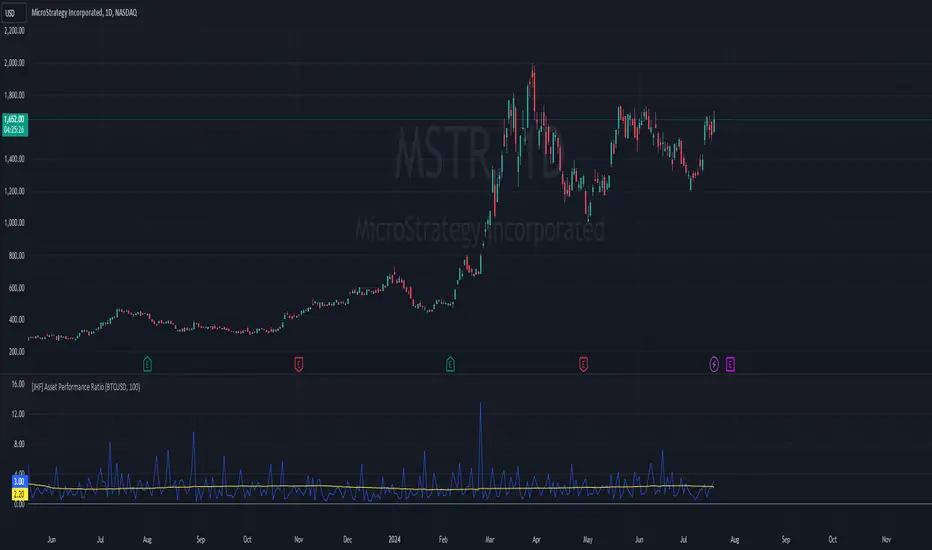
The Asset Performance Ratio indicator compares the performance of the current chart's asset (Asset 1) with a baseline asset (Asset 2). This indicator calculates the candle range for both assets in percentage terms and computes the multiplier of Asset 1's range relative to Asset 2's range. It also provides a moving average of this multiplier over a specified period.
Features:
Inputs:
How It Works:
Example Use Case:
Use this indicator to compare the volatility or performance of a stock against a cryptocurrency, providing insights into their relative movements and aiding in making informed trading decisions.
Features:
- Baseline Asset Selection: Choose any asset as the baseline for comparison.
- Period Customization: Set the period for the moving average to suit your analysis.
- Dynamic Calculation: Automatically uses the current chart's ticker as Asset 1.
- Visual Representation: Plots both the multiplier and its moving average for easy interpretation.
Inputs:
- Baseline Asset (Default: BTCUSD): The ticker symbol of the baseline asset against which the current chart's asset is compared.
- Period (Default: 100): The number of periods over which the moving average of the multiplier is calculated.
How It Works:
- Candle Data Retrieval:
- The script fetches high, low, open, and close prices for both the current chart's asset and the baseline asset.
- Percentage Range Calculation:
- Calculates the candle range as a percentage of the opening price for both assets.
- Multiplier Calculation:
- Computes the multiplier as the ratio of the percentage range of the current chart's asset to that of the baseline asset.
- Moving Average Calculation:
- Calculates the simple moving average (SMA) of the multiplier over the specified period.
- Plotting:
- Plots the multiplier and its moving average for easy visual comparison.
Example Use Case:
Use this indicator to compare the volatility or performance of a stock against a cryptocurrency, providing insights into their relative movements and aiding in making informed trading decisions.
Sürüm Notları
Updated Chart.Sürüm Notları
Updated labelsAçık kaynak kodlu komut dosyası
Gerçek TradingView ruhuyla, bu komut dosyasının mimarı, yatırımcıların işlevselliğini inceleyip doğrulayabilmesi için onu açık kaynaklı hale getirdi. Yazarı tebrik ederiz! Ücretsiz olarak kullanabilseniz de, kodu yeniden yayınlamanın Topluluk Kurallarımıza tabi olduğunu unutmayın.
The Real World - Stocks Campus:
Stocks, Options, Futures, Forex, Crypto, this is what we trade.
Learn profitable trading systems or build your own, just like I did.
jointherealworld.com/?a=tkbmft8bqf
Stocks, Options, Futures, Forex, Crypto, this is what we trade.
Learn profitable trading systems or build your own, just like I did.
jointherealworld.com/?a=tkbmft8bqf
Feragatname
Bilgiler ve yayınlar, TradingView tarafından sağlanan veya onaylanan finansal, yatırım, alım satım veya diğer türden tavsiye veya öneriler anlamına gelmez ve teşkil etmez. Kullanım Koşulları bölümünde daha fazlasını okuyun.
Açık kaynak kodlu komut dosyası
Gerçek TradingView ruhuyla, bu komut dosyasının mimarı, yatırımcıların işlevselliğini inceleyip doğrulayabilmesi için onu açık kaynaklı hale getirdi. Yazarı tebrik ederiz! Ücretsiz olarak kullanabilseniz de, kodu yeniden yayınlamanın Topluluk Kurallarımıza tabi olduğunu unutmayın.
The Real World - Stocks Campus:
Stocks, Options, Futures, Forex, Crypto, this is what we trade.
Learn profitable trading systems or build your own, just like I did.
jointherealworld.com/?a=tkbmft8bqf
Stocks, Options, Futures, Forex, Crypto, this is what we trade.
Learn profitable trading systems or build your own, just like I did.
jointherealworld.com/?a=tkbmft8bqf
Feragatname
Bilgiler ve yayınlar, TradingView tarafından sağlanan veya onaylanan finansal, yatırım, alım satım veya diğer türden tavsiye veya öneriler anlamına gelmez ve teşkil etmez. Kullanım Koşulları bölümünde daha fazlasını okuyun.