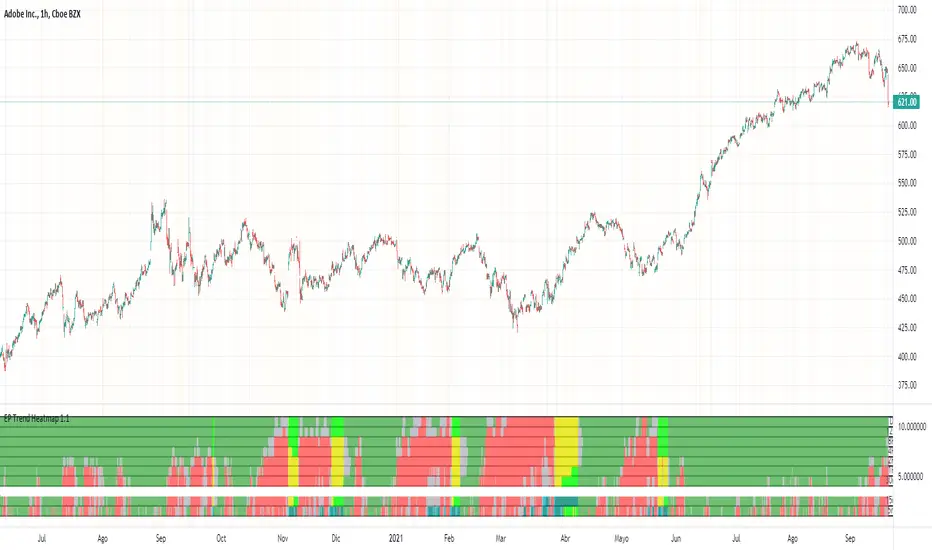
EP Trend Heatmap MTF

These timeframes are configurable.
By default, two fast timeframes (5 and 15 min) and 7 timeframes of higher temporalities are shown (30m, 1H, 2H, 4H, 8H, 12H and 1D).
The first two timeframes can be used to fit inputs into very small time frames.
The colors indicate:
green: buying trend
red: selling trend
gray: neutral or undefined trend
aqua: converging long averages (emaLTC rising below emaLTD)
teal: converging long averages and buying trend
The indicator is very effective in detecting the recovery of the price after a fall. In these cases, it will show bluish colors (aqua and teal) in the lower timeframes, while the red colors give way to neutral and green colors in the higher ones, in a staggered way.
During a strong uptrend, we will see all the timeframes in green, except in the breaks that the price makes, where we will wait for the red colors in lower timeframes to give way to the neutral color and the subsequent green.
When the top 7 timeframes turn green ("green wall" pattern) it will be a good time to buy.
The indicator uses a total of 10 configurable averages.
It is based on the same averages as the EP Prism indicator, so we recommend using them together, which will improve the accuracy of the latter's input signals.
- The "Clear Sky" pattern is now displayed.
This pattern shows the situation of convergent averages in lower TimeFrames and the absence of sales trends in higher timeframes, preceding a possible rise in price. It will show yellow color on neutral TFs, and more intense green on uptrend TFs.
- An option has been added in the configuration to relax the criteria for the appearance of the pattern. The pattern will be displayed even if there are selling trends above the specified timeframe.
"Allow reds above TF # (a number from 5 to 9)"
9 = not relax.
The default value is 8. Lower values may cause errors in the evaluation of the actual situation.
Yalnızca davetli komut dosyası
Bu komut dosyasına yalnızca yazar tarafından onaylanan kullanıcılar erişebilir. Kullanmak için izin istemeniz ve almanız gerekir. Bu izin genellikle ödeme yapıldıktan sonra verilir. Daha fazla ayrıntı için aşağıdaki yazarın talimatlarını izleyin veya doğrudan EP-Trading ile iletişime geçin.
Bu özel yani yalnızca davetlilere açık komut dosyasının, komut dosyası moderatörleri tarafından incelenmediğini ve Site Kuralları ile uyumluluğunun belirsiz olduğunu unutmayın. TradingView, yazarına tam olarak güvenmediğiniz ve nasıl çalıştığını anlamadığınız sürece bir komut dosyası için ödeme yapmanızı veya kullanmanızı ÖNERMEZ. Ayrıca topluluk komut dosyaları bölümümüzde ücretsiz, açık kaynaklı alternatifler bulabilirsiniz.
Yazarın talimatları
Uyarı: Erişim talebinde bulunmadan önce lütfen yalnızca davetli komut dosyaları kılavuzumuzu okuyun.
Feragatname
Yalnızca davetli komut dosyası
Bu komut dosyasına yalnızca yazar tarafından onaylanan kullanıcılar erişebilir. Kullanmak için izin istemeniz ve almanız gerekir. Bu izin genellikle ödeme yapıldıktan sonra verilir. Daha fazla ayrıntı için aşağıdaki yazarın talimatlarını izleyin veya doğrudan EP-Trading ile iletişime geçin.
Bu özel yani yalnızca davetlilere açık komut dosyasının, komut dosyası moderatörleri tarafından incelenmediğini ve Site Kuralları ile uyumluluğunun belirsiz olduğunu unutmayın. TradingView, yazarına tam olarak güvenmediğiniz ve nasıl çalıştığını anlamadığınız sürece bir komut dosyası için ödeme yapmanızı veya kullanmanızı ÖNERMEZ. Ayrıca topluluk komut dosyaları bölümümüzde ücretsiz, açık kaynaklı alternatifler bulabilirsiniz.
Yazarın talimatları
Uyarı: Erişim talebinde bulunmadan önce lütfen yalnızca davetli komut dosyaları kılavuzumuzu okuyun.