Institutional Signal Engine (ISE)
ISE is a multi-layer institutional trading system that combines trend, volatility, volume, and multi-timeframe logic into one advanced framework.
It identifies high-probability reversals, institutional accumulation/distribution phases, and Smart Buy/Sell setups confirmed by higher-timeframe filters.
The indicator integrates:
TSI–RSI–ATR dashboard (weekly basis)
Monthly trend filter (long-term direction)
A/D Line divergences and volume spikes on compression
Dynamic Sigma ±1…±4 volume bands (VWMA-based)
Smart visual signals, alerts, and real-time data tables
⚙️ Core Logic – Step by Step
1️⃣ Multi-Timeframe Engine
Calculates TSI, RSI, and ATR on the weekly timeframe to filter out short-term noise.
Uses a 10-period SMA on monthly close as long-term filter:
Above = monthly bullish bias
Below = monthly bearish bias
2️⃣ Weekly Trend Change Detection
A 10-bar SMA defines the weekly trend:
Green arrow “▲” = Bullish reversal
Red arrow “▼” = Bearish reversal
Automatic alerts are triggered when a reversal occurs.
3️⃣ Directional Score (0–100%)
A 4-factor composite score measures directional strength:
Component Weight Effect
TSI trend direction 25% Momentum bias
RSI above/below 50 25% Market strength
ATR above volatility threshold 25% Volatility confirmation
Monthly trend alignment 25% Institutional filter
Score ≥ 75% = strong institutional confirmation
Combined with monthly bias, this defines Smart Entry Zones
4️⃣ Institutional Module
🔸 A/D Line Divergences
Detects when volume flow diverges from price:
Price down + A/D up → bullish divergence (accumulation)
Price up + A/D down → bearish divergence (distribution)
🔸 Volume Spikes on Compression
Flags breakouts when price range contracts but volume surges sharply.
Indicates institutional activity and momentum expansion.
🔸 Smart Buy / Smart Sell Conditions
Smart signals appear only when all conditions align:
Divergence or volume spike,
Score ≥ 75%,
Monthly trend confirmation,
(Optional) Weekly trend reversal if enabled.
✅ Smart Buy (C) → Green triangle below bar
✅ Smart Sell (V) → Red triangle above bar
5️⃣ Advanced Visual Signals
Symbol Meaning Interpretation
▲ / ▼ Weekly trend reversal Direction change
🟢 C / 🔴 V Smart Buy / Smart Sell Institutional setup
🔵 / 🟠 Circles Ideal confirmed trades Retrospective validation
💠 Fuchsia Diamond Probable low Anticipated bullish reversal
↟ / ↡ RSI/SMA extreme cross Visual early warning
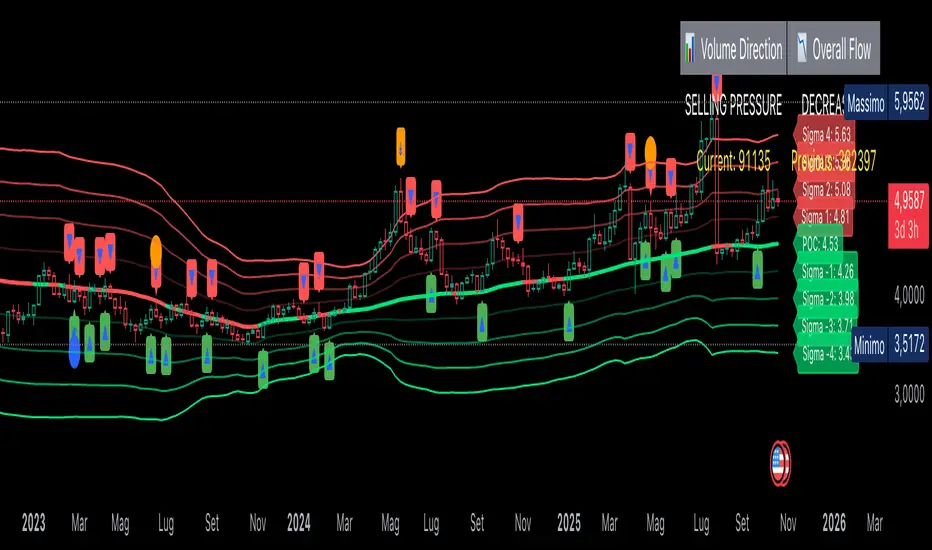
6️⃣ Sigma ±1..±4 Volume Bands (VWMA-70)
Based on Volume Weighted Moving Average (VWMA 70), not Bollinger.
Defines 4 upper and 4 lower Sigma levels relative to the current equilibrium (POC).
Acts as a probabilistic map of volume balance zones.
Labels display real-time price values for each band (auto-updated each bar).
7️⃣ Real-Time Information Tables
📋 Oscillator Table (Right side)
Displays the status of three oscillators:
Indicator Signal
Stochastic BUY / SELL / NEUTRAL
Fisher Transform BUY / SELL / NEUTRAL
Williams %R BUY / SELL / NEUTRAL
Colors: 🟢 = Buy, 🔴 = Sell, 🟠 = Neutral
📊 Volume Table (Top right)
Shows:
Volume Direction: buying / selling / neutral
Trend vs previous bar: increasing / decreasing / stable
Current vs previous volume values
🧠 How to Use and Interpret
🔹 Step 1 – Identify Context
Use the monthly filter and weekly arrows to determine the institutional direction.
📈 Both up = bullish environment
📉 Both down = bearish environment
Mixed = neutral / uncertain
🔹 Step 2 – Wait for Alignment
Trade only when Smart Signals appear in the same direction as the higher timeframe trend.
Green “C” = buy signal within bullish structure
Red “V” = sell signal within bearish structure
🔹 Step 3 – Confirm with Volumes and Sigma Bands
If price is near Sigma −2 / −3, expect potential rebound (buy zones).
If price is near Sigma +2 / +3, expect exhaustion (sell zones).
Strong volume spike + Smart signal = institutional confirmation
🔹 Step 4 – Manage Trades
Use weekly ATR or Sigma ±2 as volatility-based stop levels.
Exit on opposite Smart signal or trend reversal arrow.
📈 Interpretation Summary
Condition Meaning Bias
Green ▲ + Smart Buy + Score ≥75 Confirmed bullish reversal Long setup
Red ▼ + Smart Sell + Score ≥75 Confirmed bearish reversal Short setup
Fuchsia Diamond ⚡ Probable local bottom Early long opportunity
Narrow Sigma bands Compression → Pre-breakout Wait for expansion
Wide Sigma bands High volatility / exhaustion Avoid new entries
⚡ Summary
Aspect Description
Name Lanfranco Bilotti – Institutional Trading + Alert
Structure Multi-timeframe, multi-indicator system
Core Modules TSI, RSI, ATR, A/D Divergence, Volume Spike, Sigma Bands
Signals Smart Buy/Sell, Probable Low, Trend Arrows
Alerts Automatic weekly reversal alerts
Filters Weekly and monthly trend filters
Output Visual dashboard + dual data tables
Best timeframe Weekly or Daily (for institutional flow)
Main goal Detect institutional trend phases and confirm high-probability entries
💼 Trading Instructions (Usage Guide) !!!!
🔹 Step-by-Step Usage
1️⃣ Choose timeframe
Recommended use on Daily or Weekly charts.
Institutional alignment works best when Weekly = Monthly trend.
2️⃣ Identify market context
📈 Bullish environment: Monthly filter = UP and weekly arrow ▲
📉 Bearish environment: Monthly filter = DOWN and weekly arrow ▼
3️⃣ Wait for confirmation
Smart BUY (C) → appears only when volume, trend, and oscillators align.
Smart SELL (V) → confirmed institutional distribution setup.
4️⃣ Entry rules (example)
Long entry: when Smart BUY (C) appears and the current price is near Sigma −1 or −2.
Short entry: when Smart SELL (V) appears and the price is near Sigma +1 or +2.
5️⃣ Stop loss suggestion (statistical)
Use weekly ATR or next Sigma band as volatility-based stop.
Example: if entry at Sigma −1 → stop below Sigma −2.
6️⃣ Exit strategy
Exit when the opposite Smart Signal appears (C → V or V → C).
Or when a new weekly reversal arrow ▲ / ▼ is printed.
🔹 Interpretation Summary
Symbol Meaning Action Bias
▲ / ▼ Weekly trend reversal Confirms long / short bias
🟢 C Smart Buy Long entry zone
🔴 V Smart Sell Short entry zone
💠 Fuchsia Diamond Probable low Early long opportunity
↟ / ↡ RSI/SMA extreme Momentum exhaustion zone
=================================================
Trade only in the direction of the higher timeframe trend.
Smart BUY (C) → enter long when price is near Sigma −1 / −2 and monthly trend = UP.
Smart SELL (V) → enter short when price is near Sigma +1 / +2 and monthly trend = DOWN.
Exit on the opposite Smart signal or when a new weekly arrow ▲ / ▼ appears.
Use the weekly ATR or next Sigma band for stop-loss placement.
Always confirm signals at candle close.
Yalnızca davetli komut dosyası
Bu komut dosyasına yalnızca yazar tarafından onaylanan kullanıcılar erişebilir. Kullanmak için izin istemeniz ve almanız gerekir. Bu izin genellikle ödeme yapıldıktan sonra verilir. Daha fazla ayrıntı için aşağıdaki yazarın talimatlarını izleyin veya doğrudan LanfryBil ile iletişime geçin.
TradingView, yazarına tam olarak güvenmediğiniz ve nasıl çalıştığını anlamadığınız sürece bir komut dosyası için ödeme yapmanızı veya kullanmanızı ÖNERMEZ. Ayrıca topluluk komut dosyaları bölümümüzde ücretsiz, açık kaynaklı alternatifler bulabilirsiniz.
Yazarın talimatları
Feragatname
Yalnızca davetli komut dosyası
Bu komut dosyasına yalnızca yazar tarafından onaylanan kullanıcılar erişebilir. Kullanmak için izin istemeniz ve almanız gerekir. Bu izin genellikle ödeme yapıldıktan sonra verilir. Daha fazla ayrıntı için aşağıdaki yazarın talimatlarını izleyin veya doğrudan LanfryBil ile iletişime geçin.
TradingView, yazarına tam olarak güvenmediğiniz ve nasıl çalıştığını anlamadığınız sürece bir komut dosyası için ödeme yapmanızı veya kullanmanızı ÖNERMEZ. Ayrıca topluluk komut dosyaları bölümümüzde ücretsiz, açık kaynaklı alternatifler bulabilirsiniz.