TM_DAY_TRACKER_SUPER
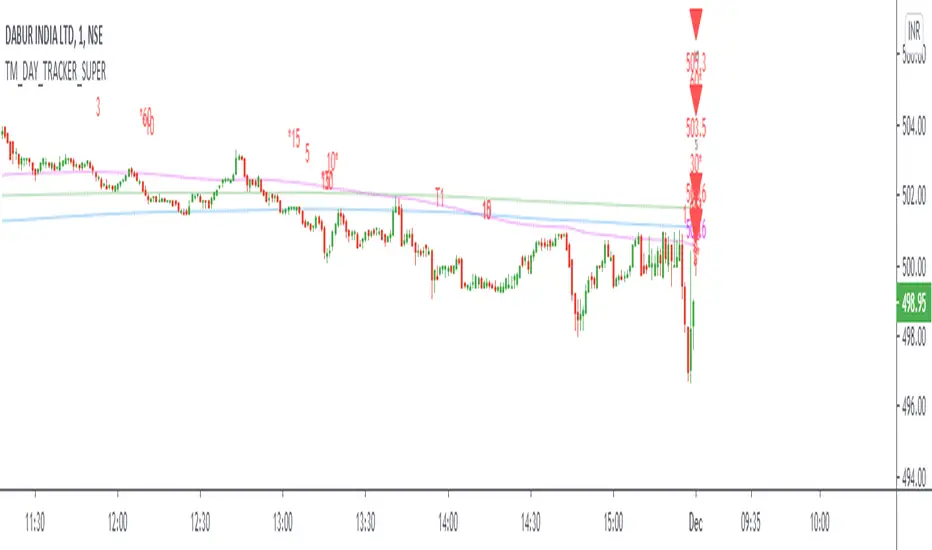
Terminology Use ==> B- Buy, S- Sale Signal, and Numbers are to show time frame indication there is presence of buyer or seller like B1 for buy signal on 1 minute time frame etc.
Display and Interpretation ==> Buy Sale Signal in B/S , Digit with 1-3-5-10-15-30-60-D for different time frames, Value with Triangle mark shows possible direction of momentum
This indicator help to identify 4 major things:-
1. Area of order Buildup
2. Price Strength
3. Direction
4. Volatility
There are 3 Line in trend chart
Green for positive trend, red for negative trend
line change color based on trend change
least dark "Green/Red" shows main trend and work as major trend line". It describe which side market will take momentum and whenever price come to this area, very important for position build up either long side or short side"
light dark "Green/Red" work as primary support / resistance and area of value. During the price movement price takes support or resistance here and bounce back or reverse back"
most dark "blue/purple" work as volatility line . This is area of volatility and direction to main trend. Price crossing above or below will give huge direction movement
==> 2 line in common color "Green/Red" shows main trend
Use market structure, chart pattern, trend lines for more support..
There is 1 dot in chart, This dot show accumulation or distribution price, Green / Red line shows market strength. Signal with 1-3-5-10-15-30-60-D shows active order position over time frame and 1 with Price Value like show area of momentum or volatility . Signal on higher the time frame , more strong momentum
Time frame ==> Use proper Signal with swing trend on 1 minute, 3 minute 5 minute, 15 minute time frame
What to Identify ==> Overall Trend for the intraday and swing Period
How to Use ==>
See how and order buildup is seen and current order position. Also area for volatility and expected movement in price direction
Note: - Use market structure, chart pattern, trend lines and price action parameter for more confirmation.
Entry ==>
Let’s wait the proper area of support or resistance ( Area of Value in case of trend pattern use)
Exit ==>
SL of swing high/low out of market structure with proper risk management and target with proper Risk/ Reward Ratio
Use the Below Contacts to Access this Indicator
Yalnızca davetli komut dosyası
Bu komut dosyasına yalnızca yazar tarafından onaylanan kullanıcılar erişebilir. Kullanmak için izin istemeniz ve almanız gerekir. Bu izin genellikle ödeme yapıldıktan sonra verilir. Daha fazla ayrıntı için aşağıdaki yazarın talimatlarını izleyin veya doğrudan TradingMind24 ile iletişime geçin.
TradingView, yazarına tam olarak güvenmediğiniz ve nasıl çalıştığını anlamadığınız sürece bir komut dosyası için ödeme yapmanızı veya kullanmanızı ÖNERMEZ. Ayrıca topluluk komut dosyaları bölümümüzde ücretsiz, açık kaynaklı alternatifler bulabilirsiniz.
Yazarın talimatları
Feragatname
Yalnızca davetli komut dosyası
Bu komut dosyasına yalnızca yazar tarafından onaylanan kullanıcılar erişebilir. Kullanmak için izin istemeniz ve almanız gerekir. Bu izin genellikle ödeme yapıldıktan sonra verilir. Daha fazla ayrıntı için aşağıdaki yazarın talimatlarını izleyin veya doğrudan TradingMind24 ile iletişime geçin.
TradingView, yazarına tam olarak güvenmediğiniz ve nasıl çalıştığını anlamadığınız sürece bir komut dosyası için ödeme yapmanızı veya kullanmanızı ÖNERMEZ. Ayrıca topluluk komut dosyaları bölümümüzde ücretsiz, açık kaynaklı alternatifler bulabilirsiniz.