OPEN-SOURCE SCRIPT
Volatility with Sigma Bands
Overview
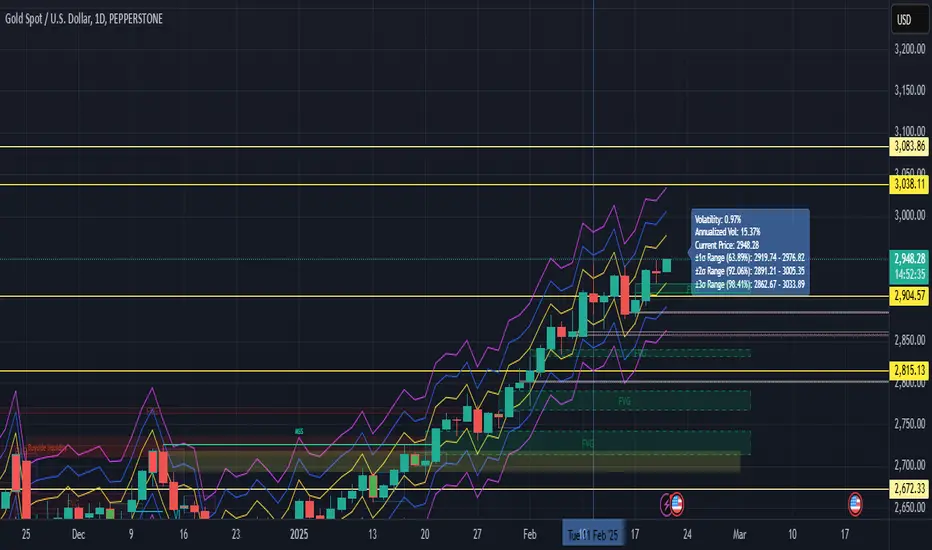
The Volatility Analysis with Sigma Bands indicator is a powerful and flexible tool designed for traders who want to gain deeper insights into market price fluctuations. It calculates historical volatility within a user-defined time range and displays ±1σ, ±2σ, and ±3σ standard deviation bands, helping traders identify potential support, resistance levels, and extreme price behaviors.
Key Features
Multiple Volatility Band Displays:
±1σ Range (Yellow line): Covers approximately 68% of price fluctuations.
±2σ Range (Blue line): Covers approximately 95% of price fluctuations.
±3σ Range (Fuchsia line): Covers approximately 99% of price fluctuations.
Dynamic Probability Mode:
Toggle between standard normal distribution probabilities (68.2%, 95.4%, 99.7%) and actual historical probability calculations, allowing for more accurate analysis tailored to varying market conditions.
Highly Customizable Label Display:
The label shows:
Real-time volatility
Annualized volatility
Current price
Price ranges for each σ level
Users can adjust the label’s position and horizontal offset to prevent it from overlapping key price areas.
Real-Time Calculation & Visualization:
The indicator updates in real-time based on the selected time range and current market data, making it suitable for day trading, swing trading, and long-term trend analysis.
Use Cases
Risk Management:
Understand the distribution probabilities of price within different standard deviation bands to set more effective stop-loss and take-profit levels.
Trend Confirmation:
Determine trend strength or spot potential reversals by observing whether the price breaks above or below ±1σ or ±2σ ranges.
Market Sentiment Analysis:
Price movement beyond the ±3σ range often indicates extreme market sentiment, providing potential reversal opportunities.
Backtesting and Historical Analysis:
Utilize the customizable time range feature to backtest volatility during various periods, providing valuable insights for strategy refinement.
The Volatility Analysis with Sigma Bands indicator is an essential tool for traders seeking to understand market volatility patterns. Whether you're a day trader looking for precise entry and exit points or a long-term investor analyzing market behavior, this indicator provides deep insights into volatility dynamics, helping you make more confident trading decisions.
Açık kaynak kodlu komut dosyası
Gerçek TradingView ruhuyla, bu komut dosyasının mimarı, yatırımcıların işlevselliğini inceleyip doğrulayabilmesi için onu açık kaynaklı hale getirdi. Yazarı tebrik ederiz! Ücretsiz olarak kullanabilseniz de, kodu yeniden yayınlamanın Topluluk Kurallarımıza tabi olduğunu unutmayın.
Feragatname
Bilgiler ve yayınlar, TradingView tarafından sağlanan veya onaylanan finansal, yatırım, alım satım veya diğer türden tavsiye veya öneriler anlamına gelmez ve teşkil etmez. Kullanım Koşulları bölümünde daha fazlasını okuyun.