PROTECTED SOURCE SCRIPT
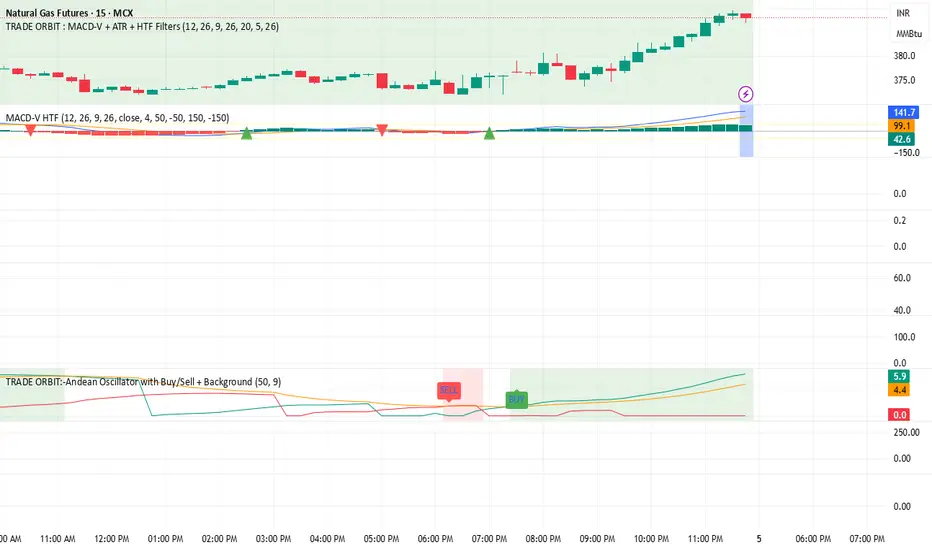
TRADE ORBIT:-Andean Oscillator with Buy/Sell + Background
//=============================================================================
// DESCRIPTION
//-----------------------------------------------------------------------------
// The Andean Oscillator is a trend-momentum tool that compares bullish and
// bearish pressure using dynamic envelopes derived from price. It evaluates
// the strength of upward vs downward movement and generates trade signals
// when bullish or bearish momentum aligns above a smoothed signal line.
//
// COMPONENTS
// -----------
// • Bull : Represents bullish pressure
// • Bear : Represents bearish pressure
// • Signal: EMA smoothing of the stronger of Bull/Bear
//
// SIGNAL LOGIC
// -------------
// ✅ BUY signal is generated when:
// 1) Bull crosses above Bear
// 2) Bull then crosses above the Signal line
//
// ✅ SELL signal is generated when:
// 1) Bear crosses above Bull
// 2) Bear then crosses above the Signal line
//
// BACKGROUND COLORS
// -----------------
// • Green background → Bull > Bear and Bull > Signal
// • Red background → Bear > Bull and Bear > Signal
//
// PLOTS
// -----
// • Green plot → Bullish component
// • Red plot → Bearish component
// • Orange plot → Signal line
//
// ADDITIONAL NOTES
// ----------------
// • Uses envelope calculation with EMA smoothing
// • State-tracking ensures proper trend recognition
// • Alert conditions are included for Buy and Sell signals
//
//=============================================================================
Korumalı komut dosyası
Bu komut dosyası kapalı kaynak olarak yayınlanmaktadır. Ancak, özgürce ve herhangi bir sınırlama olmaksızın kullanabilirsiniz – daha fazla bilgi burada.
Feragatname
Bilgiler ve yayınlar, TradingView tarafından sağlanan veya onaylanan finansal, yatırım, işlem veya diğer türden tavsiye veya tavsiyeler anlamına gelmez ve teşkil etmez. Kullanım Şartları'nda daha fazlasını okuyun.