PROTECTED SOURCE SCRIPT
Muzyorae - ICT Quarterly Theory (Intraday)

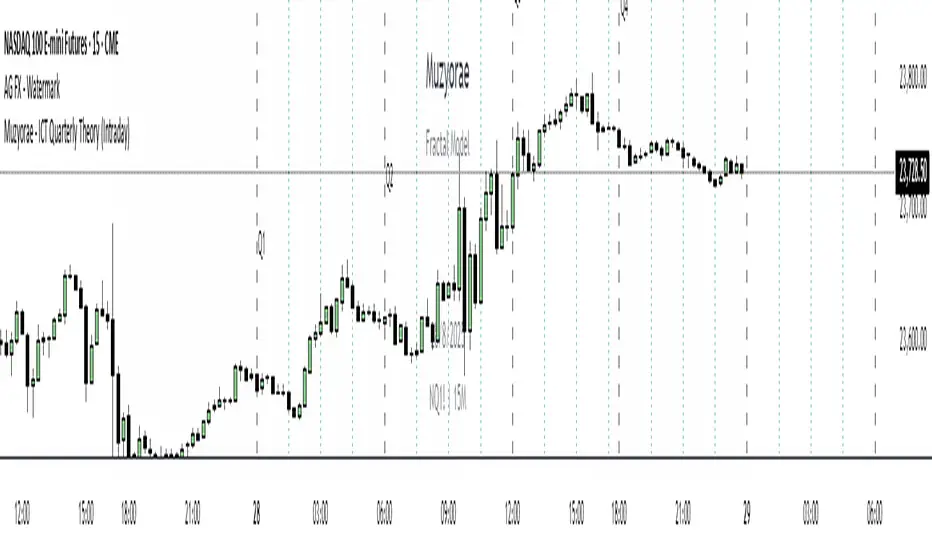
ICT Quarterly Theory — Intraday
What it is
ICT’s Quarterly Theory models the intraday session as repeating cycles of four “quarters.” On NY time, a trading day is split into four macro quarters of 6 hours each:
Q1: 00:00–06:00 NY (Asia / pre-London)
Q2: 06:00–12:00 NY (London–NY overlap, AM session)
Q3: 12:00–18:00 NY (Midday / PM session)
Q4: 18:00–24:00 NY (Asia re-open / late session)
Each macro quarter can be further subdivided into micro quarters of 90 minutes (q1–q4). This fractal view helps traders frame accumulation → expansion → distribution → liquidation phases and align executions with time-of-day liquidity.
Why it matters
Orderflow, liquidity raids, and displacement are highly time-dependent. Marking the quarters makes it easier to:
Anticipate when the market is likely to deliver the day’s expansion (often Q2) versus retracement/distribution (often Q3) or late liquidity runs (often Q4).
Compare today’s behavior to prior days within the same quarter windows.
Anchor bias, entries, and risk management to session-specific highs/lows rather than arbitrary clock times.
What this indicator shows
Macro quarters (6h): Vertical lines and optional labels (Q1–Q4) on NY time.
Micro quarters (90m): Optional finer verticals inside each macro quarter (q1–q4) for precise timing.
True Open (Q2 AM): Optional line at the AM session’s true open (default 06:00 NY) to study premium/discount development from the intraday benchmark.
Futures Sunday handling: Optional treatment of Sunday 18:00 NY as Q4 (useful for FX/futures).
Label controls: Choose above/below placement, offset, size, and colors; micro labels can be toggled independently.
Performance-friendly: De-duplicated labels and a look-back “days to show” setting keep charts clean.
How to use
Timeframe: Works on intraday charts (1–60m). 5–15m is a common balance of signal vs. noise.
Bias framing:
Map Asia (Q1), AM expansion (Q2), midday distribution (Q3), late session runs (Q4).
Compare where the daily range forms versus the True Open to gauge premium/discount and likely continuations.
Execution: Look for standard ICT tools (liquidity sweeps, FVGs, displacement, PD arrays) inside the active quarter to avoid fighting time-of-day flow.
Review: Scroll back multiple days and evaluate where the day’s high/low typically forms relative to Q2–Q3; adapt expectations.
Settings (high level)
Show Macro Labels / Micro Lines / Micro Labels
Label position (above/below), X-shift, colors, sizes
Days to show, de-dup window (prevents label overlaps)
Q2 True Open toggle and extension (doesn't work)
Include Sunday as Q4 (18:00 NY)
Notes
Quarter boundaries are fixed to America/New York session logic to match ICT timing.
This is a context tool; it does not generate buy/sell signals. Combine with your existing execution model.
Past behavior does not guarantee future results. Use proper risk management.
Korumalı komut dosyası
Bu komut dosyası kapalı kaynak olarak yayınlanmaktadır. Ancak, ücretsiz ve herhangi bir sınırlama olmaksızın kullanabilirsiniz – daha fazla bilgiyi buradan edinebilirsiniz.
Feragatname
Bilgiler ve yayınlar, TradingView tarafından sağlanan veya onaylanan finansal, yatırım, alım satım veya diğer türden tavsiye veya öneriler anlamına gelmez ve teşkil etmez. Kullanım Koşulları bölümünde daha fazlasını okuyun.