OPEN-SOURCE SCRIPT
Candle Price Movement
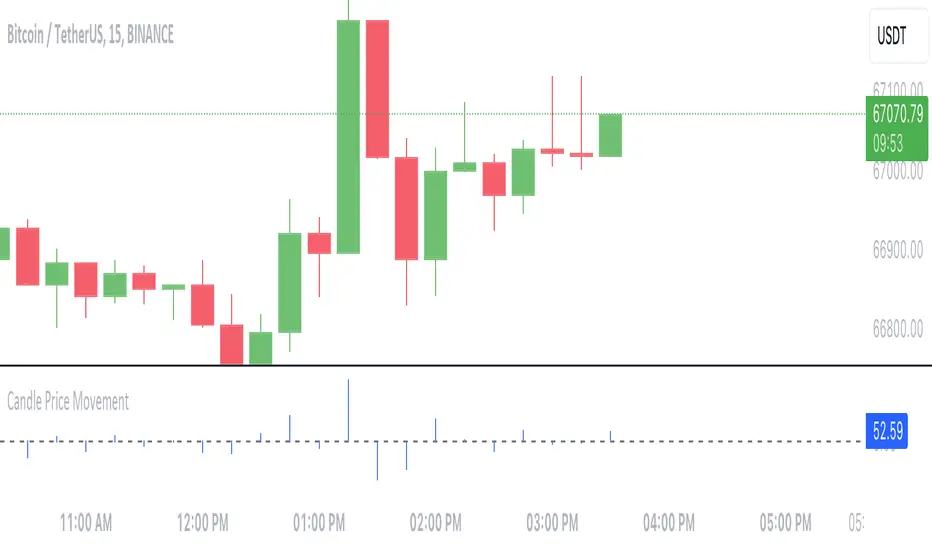
This Pine Script indicator calculates and visualizes the price movement for each candlestick on the chart.
- **Calculation**: The price movement for each candle is determined by subtracting the opening price from the closing price.
- **Visualization**: The price movement is plotted as a histogram, with positive values indicating upward movement (green bars) and negative values indicating downward movement (red bars).
- **Options**:
- The histogram bars are colored blue with zero opacity, providing a clear visual distinction from the background.
- A horizontal line at zero (the "Zero Line") is added for reference, helping to identify periods of no price movement.
---
This indicator provides traders with a quick visualization of the price movement for each candlestick, helping to identify trends and potential trading opportunities.
Açık kaynak kodlu komut dosyası
Gerçek TradingView ruhuyla, bu komut dosyasının mimarı, yatırımcıların işlevselliğini inceleyip doğrulayabilmesi için onu açık kaynaklı hale getirdi. Yazarı tebrik ederiz! Ücretsiz olarak kullanabilseniz de, kodu yeniden yayınlamanın Topluluk Kurallarımıza tabi olduğunu unutmayın.
Feragatname
Bilgiler ve yayınlar, TradingView tarafından sağlanan veya onaylanan finansal, yatırım, alım satım veya diğer türden tavsiye veya öneriler anlamına gelmez ve teşkil etmez. Kullanım Koşulları bölümünde daha fazlasını okuyun.