INVITE-ONLY SCRIPT
Market Trading Tools - Divergences
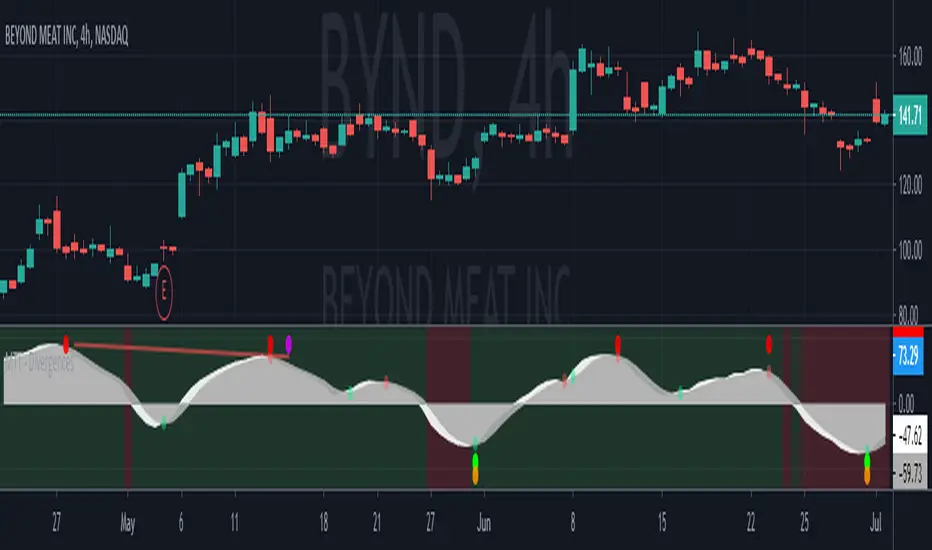
Our Divergence indicator is another indicator we are happy to present to interested traders. The indicator detects the possible trend change and it is a well known tool among traders based on bullish and bearish divergences.
To use the indicator well, it will spot divergences but some minimal work might be needed to be done as connecting the waves together to make sure that you get the best entries. You can also wait for the dots to appear in order to take a trade either long or short depending on whatever financial market you are trading and your trading strategy.
The red dots will signify a bearish divergence (trend reversal to the downside), while the green dots will signify a bullish divergence (trend reversal to the upside). The orange and purple dots also will signify a stronger divergence either bullish or bearish .
The divergence indicator we are publishing today works on crypto, stocks, forex, futures and almost all financial assets, however we do recommend using higher time frames for better results and to filter the noise around the divergences (dots), however using lower time frames can just allow you a better entry sometimes since reversals happen on lower time frames than larger ones.
Once you are granted access to use it, add it from going into the scripts >> invite only scripts >> enable the indicator (click on it once). Once the indicator is added to your chart you will see the indicator popping up to a lower pane.
We are happy to announce that our trading indicator is special and unique from different ones because of the features added above + we have added alerts to it. We believe that the indicator plotting and style on chart is also clean and easy for the eyes to catch compared to other indicators around. We have also enabled a function for our users to get a better view of the trend when they add the indicator to their chart. You can now view the trend background color (red&green) depending on if the price is above the EMA of your choice. you can also check whichever time interval you want that does not limit you to the time interval chosen on your chart itself.
Hope you enjoy it, Good luck and stay safe!
** If you are interested in this indicator. please use the link below to obtain access to this indicator
Yalnızca davetli komut dosyası
Bu komut dosyasına erişim, yazar tarafından yetkilendirilen kullanıcılarla sınırlıdır ve genellikle ödeme gerektirir. Sık kullanılanlarınıza ekleyebilirsiniz, ancak bunu yalnızca izin talep edip yazarından bu izni aldıktan sonra kullanabileceksiniz. Daha fazla bilgi için MarketTradingTools ile iletişime geçin veya yazarın aşağıdaki talimatlarını izleyin.
TradingView, yazarına %100 güvenmediğiniz ve komut dosyasının nasıl çalıştığını anlamadığınız sürece bir komut dosyası için ödeme yapmanızı ve onu kullanmanızı önermez. Çoğu durumda, Topluluk Komut Dosyaları bölümümüzde ücretsiz olarak iyi bir açık kaynak alternatifi bulabilirsiniz.
Yazarın talimatları
″
Bu komut dosyasını bir grafikte kullanmak ister misiniz?
Uyarı: Erişim talebinde bulunmadan önce lütfen okuyun.
Feragatname
Bilgiler ve yayınlar, TradingView tarafından sağlanan veya onaylanan finansal, yatırım, işlem veya diğer türden tavsiye veya tavsiyeler anlamına gelmez ve teşkil etmez. Kullanım Şartları'nda daha fazlasını okuyun.