PROTECTED SOURCE SCRIPT
Güncellendi Volume Velocity Range (VVR)
Overview
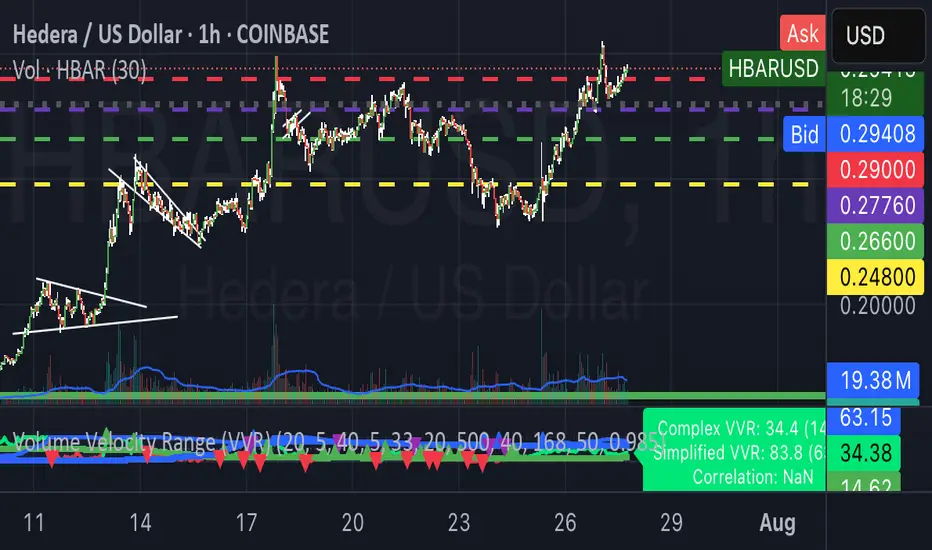
The Volume Velocity Range (VVR) is an advanced momentum oscillator that combines price movement, volume dynamics, and statistical analysis to identify potential trend changes and market extremes. Operating on a 0-100 scale, VVR provides traders with a sophisticated view of market momentum that goes beyond traditional indicators.
Key Components
1. VVR Main Oscillator (0-100)
Measures the velocity of price movement weighted by volume participation
Incorporates advanced normalization techniques to maintain consistency across different market conditions
Green when above the 33rd percentile line (bullish momentum)
Red when below the 33rd percentile line (bearish momentum)
Smoothed calculation reduces noise while maintaining responsiveness
2. Dynamic 33rd Percentile Baseline
Adaptive reference line that adjusts to recent market behavior
Acts as the key threshold for color changes and momentum assessment
Automatically switches calculation method based on:
Crypto (Hourly): 168-period rolling window (7 days)
Stocks (Hourly): Expanding window (all available history)
Daily Timeframe: 20-period rolling for all assets
Three visual styles: Dotted, Step, or Thin line
Triangle markers indicate crossover points
3. Bottom Finder Indicator
Purple line analyzing volume absorption patterns
Measures the relationship between buying/selling pressure and price movement
Helps identify potential accumulation zones and market bottoms
Particularly useful during downtrends and consolidation periods
Visual Features
Trend Status Label
Real-time trend classification from "Strong Accel Up" to "Strong Accel Down"
Color-coded for quick visual reference
Updates dynamically as market conditions change
Fill Zones
Optional transparent fill between VVR and percentile line
Green when VVR is above the 33rd percentile (bullish bias)
Red when below (bearish bias)
Optional Components
VVR Slope indicator (hidden by default) for momentum rate analysis
Symbol type debugging label
ROC calculations available but hidden for advanced users
Trading Applications
Trend Identification
VVR above 33rd percentile (green) suggests bullish momentum
VVR below 33rd percentile (red) indicates bearish pressure
The 50 level serves as a general equilibrium point
Distance from percentile line indicates momentum strength
Reversal Signals
Crossovers of the 33rd percentile line are primary trend change signals
Green-to-red color changes warn of weakening momentum
Extreme readings (>80 or <20) may indicate overbought/oversold conditions
Bottom Finder divergences can signal accumulation
Risk Management
Use 33rd percentile line as dynamic support/resistance
Color changes provide immediate visual momentum shifts
Multiple timeframe analysis for confirmation
Alert Conditions
VVR crossing 50 (midline equilibrium)
VVR crossing 33rd percentile (primary signal)
Trend direction changes
Extreme level alerts (70/30)
Best Practices
For Crypto Trading
Utilizes 7-day rolling window on hourly charts
Adapts to 24/7 market dynamics
Particularly effective for momentum-based strategies
For Stock Trading
Expanding window captures long-term market character
Ideal for swing trading and position entries
Works well with volume-based strategies
Timeframe Considerations
Hourly: Best for short-term momentum trades
Daily: Optimal for swing trading positions
Automatically adjusts calculations based on timeframe
Customization Options
Adjust calculation periods for different trading styles
Toggle visual components based on preference
Color scheme fully customizable
Line styles and fills can be modified
Advanced Features
Intelligent asset detection (crypto vs stocks)
Automatic timeframe optimization
Statistical normalization for consistency
Safety mechanisms prevent extreme readings
This indicator represents a comprehensive approach to momentum analysis, combining traditional technical analysis concepts with modern statistical methods and adaptive calculations. It's designed for traders who need reliable signals across different market conditions and asset classes.
Sürüm Notları
OverviewThe Volume Velocity Range (VVR) is an advanced momentum oscillator that combines price movement, volume dynamics, and statistical analysis to identify potential trend changes and market extremes. Operating on a 0-100 scale, VVR provides traders with a sophisticated view of market momentum that goes beyond traditional indicators.
Key Components
1. VVR Main Oscillator (0-100)
Measures the velocity of price movement weighted by volume participation
Incorporates advanced normalization techniques to maintain consistency across different market conditions
Green when above the 33rd percentile line (bullish momentum)
Red when below the 33rd percentile line (bearish momentum)
Smoothed calculation reduces noise while maintaining responsiveness
2. Dynamic 33rd Percentile Baseline
Adaptive reference line that adjusts to recent market behavior
Acts as the key threshold for color changes and momentum assessment
Automatically switches calculation method based on:
Crypto (Hourly): 168-period rolling window (7 days)
Stocks (Hourly): Expanding window (all available history)
Daily Timeframe: 20-period rolling for all assets
Three visual styles: Dotted, Step, or Thin line
Triangle markers indicate crossover points
3. Bottom Finder Indicator
Purple line analyzing volume absorption patterns
Measures the relationship between buying/selling pressure and price movement
Helps identify potential accumulation zones and market bottoms
Particularly useful during downtrends and consolidation periods
Visual Features
Trend Status Label
Real-time trend classification from "Strong Accel Up" to "Strong Accel Down"
Color-coded for quick visual reference
Updates dynamically as market conditions change
Fill Zones
Optional transparent fill between VVR and percentile line
Green when VVR is above the 33rd percentile (bullish bias)
Red when below (bearish bias)
Optional Components
VVR Slope indicator (hidden by default) for momentum rate analysis
Symbol type debugging label
ROC calculations available but hidden for advanced users
Trading Applications
Trend Identification
VVR above 33rd percentile (green) suggests bullish momentum
VVR below 33rd percentile (red) indicates bearish pressure
The 50 level serves as a general equilibrium point
Distance from percentile line indicates momentum strength
Reversal Signals
Crossovers of the 33rd percentile line are primary trend change signals
Green-to-red color changes warn of weakening momentum
Extreme readings (>80 or <20) may indicate overbought/oversold conditions
Bottom Finder divergences can signal accumulation
Risk Management
Use 33rd percentile line as dynamic support/resistance
Color changes provide immediate visual momentum shifts
Multiple timeframe analysis for confirmation
Alert Conditions
VVR crossing 50 (midline equilibrium)
VVR crossing 33rd percentile (primary signal)
Trend direction changes
Extreme level alerts (70/30)
Best Practices
For Crypto Trading
Utilizes 7-day rolling window on hourly charts
Adapts to 24/7 market dynamics
Particularly effective for momentum-based strategies
For Stock Trading
Expanding window captures long-term market character
Ideal for swing trading and position entries
Works well with volume-based strategies
Timeframe Considerations
Hourly: Best for short-term momentum trades
Daily: Optimal for swing trading positions
Automatically adjusts calculations based on timeframe
Customization Options
Adjust calculation periods for different trading styles
Toggle visual components based on preference
Color scheme fully customizable
Line styles and fills can be modified
Advanced Features
Intelligent asset detection (crypto vs stocks)
Automatic timeframe optimization
Statistical normalization for consistency
Safety mechanisms prevent extreme readings
This indicator represents a comprehensive approach to momentum analysis, combining traditional technical analysis concepts with modern statistical methods and adaptive calculations. It's designed for traders who need reliable signals across different market conditions and asset classes.
Sürüm Notları
Only shows on hourly and daily charts as it was designed. A message will display on other unsupported timeframes. Sürüm Notları
Updated to use a slightly simpler logic for calculating volume velocity/volume intensity.Sürüm Notları
I've updated the script so that the arrows now appear on the bar AFTER the crossover occurs.Sürüm Notları
Added additional directional logic.Sürüm Notları
Additional logic clean up, removed direction. Daily is the best timeframe so only use hourly if daily is looking good.Sürüm Notları
Combined direction with pure volumeKorumalı komut dosyası
Bu komut dosyası kapalı kaynak olarak yayınlanmaktadır. Ancak, ücretsiz ve herhangi bir sınırlama olmaksızın kullanabilirsiniz – daha fazla bilgiyi buradan edinebilirsiniz.
Feragatname
Bilgiler ve yayınlar, TradingView tarafından sağlanan veya onaylanan finansal, yatırım, alım satım veya diğer türden tavsiye veya öneriler anlamına gelmez ve teşkil etmez. Kullanım Koşulları bölümünde daha fazlasını okuyun.
Korumalı komut dosyası
Bu komut dosyası kapalı kaynak olarak yayınlanmaktadır. Ancak, ücretsiz ve herhangi bir sınırlama olmaksızın kullanabilirsiniz – daha fazla bilgiyi buradan edinebilirsiniz.
Feragatname
Bilgiler ve yayınlar, TradingView tarafından sağlanan veya onaylanan finansal, yatırım, alım satım veya diğer türden tavsiye veya öneriler anlamına gelmez ve teşkil etmez. Kullanım Koşulları bölümünde daha fazlasını okuyun.