OPEN-SOURCE SCRIPT
Güncellendi Multiple SMAs
Plots multiple SMAs in a single indicator.
This script only plots the SMAs if the timeframe is set to daily.
- SMA10 in light blue
- SMA20 in yellow
- SMA50 in red
- SMA100 in green
- SMA200 in blue
It also plots the crosses between SMA20 and SMA50
This script only plots the SMAs if the timeframe is set to daily.
- SMA10 in light blue
- SMA20 in yellow
- SMA50 in red
- SMA100 in green
- SMA200 in blue
It also plots the crosses between SMA20 and SMA50
Sürüm Notları
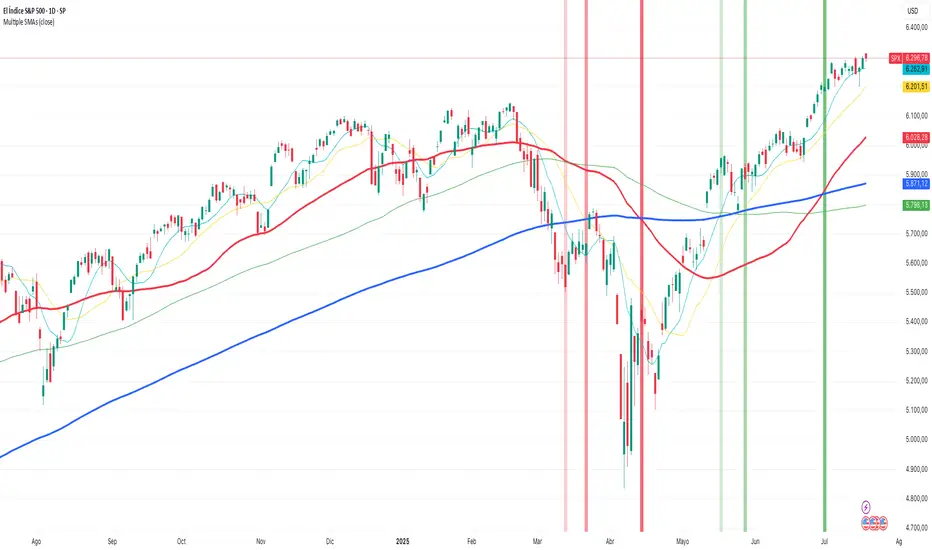
Plots multiple SMAs in a single indicator.This script only plots the SMAs if the timeframe is set to daily, weekly or monthly.
- SMA10 in light blue (daily or weekly)
- SMA20 in yellow (daily or weekly)
- SMA50 in red (daily or weekly)
- SMA100 in green
- SMA200 in blue
It also plots entry and exit alerts,
- Crosses between SMA10 and SMA200 (very light green/red vertical bar)
- Crosses between SMA20 and SMA200 (light green/red vertical bar)
- Crosses between SMA50 and SMA200 (green/red vertical bar)
Açık kaynak kodlu komut dosyası
Gerçek TradingView ruhuyla, bu komut dosyasının mimarı, yatırımcıların işlevselliğini inceleyip doğrulayabilmesi için onu açık kaynaklı hale getirdi. Yazarı tebrik ederiz! Ücretsiz olarak kullanabilseniz de, kodu yeniden yayınlamanın Topluluk Kurallarımıza tabi olduğunu unutmayın.
Feragatname
Bilgiler ve yayınlar, TradingView tarafından sağlanan veya onaylanan finansal, yatırım, alım satım veya diğer türden tavsiye veya öneriler anlamına gelmez ve teşkil etmez. Kullanım Koşulları bölümünde daha fazlasını okuyun.