PROTECTED SOURCE SCRIPT
Z-Score Probability Indicator 2.0
Z-Score Probability Indicator 2.0 — by TanTechTrades™
See trend shifts before they’re obvious.
This upgraded Z-Score toolkit combines a more accurate Z-Score moving average (Z-SMA) with an optional classic SMA to separate noise from genuine regime changes. It maps price into standard-deviation space, highlights probability zones, and prints projected ±σ price levels—so you can judge where price sits in the distribution and how likely continuation or mean reversion is.
What it does
Z-Score of price (close, with optional candle view): Normalizes price relative to a rolling mean and volatility to show how extreme current levels are.
Z-SMA (trend backbone): A moving average of the Z-Score itself smooths the signal and helps confirm when a bias truly flips.
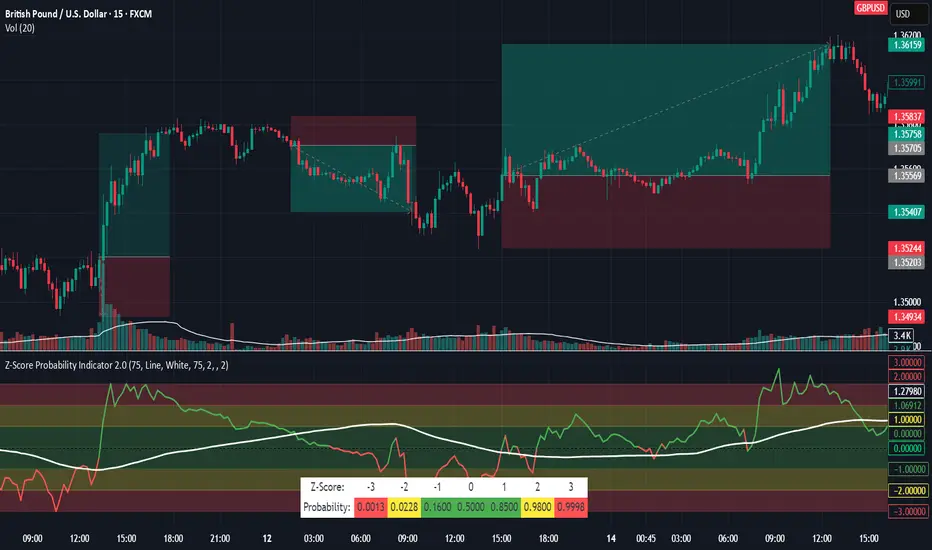
Probability bands (±1σ / ±2σ / ±3σ): Color-filled zones visualize where most observations tend to occur (green ≈ typical, yellow ≈ stretched, red ≈ statistically rare).
Projected price levels: Live labels print the price implied at 0, ±1σ, ±2σ, ±3σ using the chart’s SMA and standard deviation—handy for targets, fades, and risk framing.
Z-Table panel: A compact table shows your current Z bucket (−3 … +3) and reference probabilities at a glance.
Alert-ready regime logic: Optional alerts fire only when direction is aligned with the Z-SMA (e.g., line red and Z-SMA < 0).
How to read it
Line mode (default):
Green line above 0 → positive Z (price above its mean).
Red line below 0 → negative Z (price below its mean).
Bias confirmation: When Z-SMA crosses and holds above/below 0, the backdrop is shifting—not just wobbling.
Candle mode (optional): Renders Z-Score as candles (open/high/low/close in Z-space) to spot intrabar extremes vs. closes.
Distribution fills:
|Z| < 1 (green): typical noise / mean zone.
1 ≤ |Z| < 2 (yellow): stretched.
|Z| ≥ 2 (red): statistically rare—watch for either continuation in strong trends or snap-back risks.
Price labels (0/±1/±2/±3σ): Where price would be if it reverted to the mean or pushed to the next σ boundary—great for planning TPs/hedges.
Signals & Alerts
Green Line Alert (SMA Above 0): Z line is green and Z-SMA > 0 → pro-trend bullish context.
Red Line Alert (SMA Below 0): Z line is red and Z-SMA < 0 → pro-trend bearish context.
Use these to filter entries from your primary trigger (breakouts, pullbacks, momentum crosses, etc.).
Inputs (key settings)
Lookback Length (default 75): Window for Z-Score calc (mean & stdev).
Plot Type: Line (clean regime read) or Candles (intrabar Z detail).
SMA Length (default 75): Optional classic SMA length; reduce (e.g., 14) for responsiveness.
Distribution Probability Fills: Toggle zone shading.
Show Z-Table: On-chart Z bucket & reference probabilities.
Show SMA: Toggle the Z-SMA line.
Show SMA Standard Deviation Bands: Plots ±1σ around Z-SMA for added volatility context.
Round Target Prices Up or Down: Controls precision of the ±σ price labels.
Indicator Timeframe (Only Hourly presets): Override source timeframe (e.g., 30/60/120/240/360/720 mins).
Z-Score Line Width: Visual thickness for the main line.
Practical playbooks
Trend confirmation: Trade in the direction of the Z-SMA once it’s firmly above/below 0; use pullbacks toward 0Z as entries.
Mean-reversion fades: Look for exhaustion when Z pushes into ±2σ/±3σ zones against the Z-SMA direction.
Targets & risk: Use the projected ±σ price labels to set tiered TPs or stop placement aligned with current volatility.
Notes
Works on any symbol/timeframe; timeframe override lets you anchor to higher-timeframe hourly multiples while trading lower charts.
Z-Score is sensitive to volatility regime shifts; the Z-SMA smooths this and helps avoid whipsaw around 0.
Always pair with sound risk management; statistical “rarity” is not a guarantee of reversal.
TanTechTrades™ — turning probability into practical trading context.
See trend shifts before they’re obvious.
This upgraded Z-Score toolkit combines a more accurate Z-Score moving average (Z-SMA) with an optional classic SMA to separate noise from genuine regime changes. It maps price into standard-deviation space, highlights probability zones, and prints projected ±σ price levels—so you can judge where price sits in the distribution and how likely continuation or mean reversion is.
What it does
Z-Score of price (close, with optional candle view): Normalizes price relative to a rolling mean and volatility to show how extreme current levels are.
Z-SMA (trend backbone): A moving average of the Z-Score itself smooths the signal and helps confirm when a bias truly flips.
Probability bands (±1σ / ±2σ / ±3σ): Color-filled zones visualize where most observations tend to occur (green ≈ typical, yellow ≈ stretched, red ≈ statistically rare).
Projected price levels: Live labels print the price implied at 0, ±1σ, ±2σ, ±3σ using the chart’s SMA and standard deviation—handy for targets, fades, and risk framing.
Z-Table panel: A compact table shows your current Z bucket (−3 … +3) and reference probabilities at a glance.
Alert-ready regime logic: Optional alerts fire only when direction is aligned with the Z-SMA (e.g., line red and Z-SMA < 0).
How to read it
Line mode (default):
Green line above 0 → positive Z (price above its mean).
Red line below 0 → negative Z (price below its mean).
Bias confirmation: When Z-SMA crosses and holds above/below 0, the backdrop is shifting—not just wobbling.
Candle mode (optional): Renders Z-Score as candles (open/high/low/close in Z-space) to spot intrabar extremes vs. closes.
Distribution fills:
|Z| < 1 (green): typical noise / mean zone.
1 ≤ |Z| < 2 (yellow): stretched.
|Z| ≥ 2 (red): statistically rare—watch for either continuation in strong trends or snap-back risks.
Price labels (0/±1/±2/±3σ): Where price would be if it reverted to the mean or pushed to the next σ boundary—great for planning TPs/hedges.
Signals & Alerts
Green Line Alert (SMA Above 0): Z line is green and Z-SMA > 0 → pro-trend bullish context.
Red Line Alert (SMA Below 0): Z line is red and Z-SMA < 0 → pro-trend bearish context.
Use these to filter entries from your primary trigger (breakouts, pullbacks, momentum crosses, etc.).
Inputs (key settings)
Lookback Length (default 75): Window for Z-Score calc (mean & stdev).
Plot Type: Line (clean regime read) or Candles (intrabar Z detail).
SMA Length (default 75): Optional classic SMA length; reduce (e.g., 14) for responsiveness.
Distribution Probability Fills: Toggle zone shading.
Show Z-Table: On-chart Z bucket & reference probabilities.
Show SMA: Toggle the Z-SMA line.
Show SMA Standard Deviation Bands: Plots ±1σ around Z-SMA for added volatility context.
Round Target Prices Up or Down: Controls precision of the ±σ price labels.
Indicator Timeframe (Only Hourly presets): Override source timeframe (e.g., 30/60/120/240/360/720 mins).
Z-Score Line Width: Visual thickness for the main line.
Practical playbooks
Trend confirmation: Trade in the direction of the Z-SMA once it’s firmly above/below 0; use pullbacks toward 0Z as entries.
Mean-reversion fades: Look for exhaustion when Z pushes into ±2σ/±3σ zones against the Z-SMA direction.
Targets & risk: Use the projected ±σ price labels to set tiered TPs or stop placement aligned with current volatility.
Notes
Works on any symbol/timeframe; timeframe override lets you anchor to higher-timeframe hourly multiples while trading lower charts.
Z-Score is sensitive to volatility regime shifts; the Z-SMA smooths this and helps avoid whipsaw around 0.
Always pair with sound risk management; statistical “rarity” is not a guarantee of reversal.
TanTechTrades™ — turning probability into practical trading context.
Korumalı komut dosyası
Bu komut dosyası kapalı kaynak olarak yayınlanmaktadır. Ancak, özgürce ve herhangi bir sınırlama olmaksızın kullanabilirsiniz – daha fazla bilgi burada.
Feragatname
Bilgiler ve yayınlar, TradingView tarafından sağlanan veya onaylanan finansal, yatırım, işlem veya diğer türden tavsiye veya tavsiyeler anlamına gelmez ve teşkil etmez. Kullanım Şartları'nda daha fazlasını okuyun.