PROTECTED SOURCE SCRIPT
Güncellendi AXR-VolSD-Loc
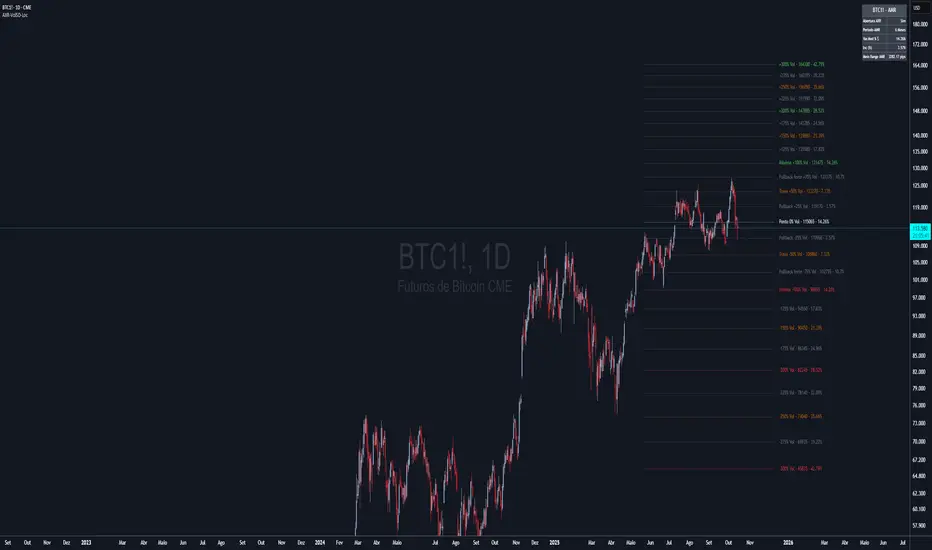
📈 AXR-VolSD-Loc — Volatility & Range Mapping Tool for Smart Traders
The AXR-VolSD-Loc indicator is a professional-grade tool designed for traders who rely on precise volatility analysis and structured range-based levels. It combines dynamic volatility bands with configurable price ranges such as ADR, AWR, AMR, and AQR — offering strategic clarity across all timeframes.
🔍 Key Features
Multi-Timeframe Range Calculation
Supports Daily (ADR), Weekly (AWR), Monthly (AMR), and Quarterly (AQR) ranges — each with independent period controls.
Standard Deviation Volatility Bands
Automatically or manually calculate standard deviation (%) to plot multiple upper/lower levels from a base price reference.
Fully Customizable Lines & Labels
Choose the number of bands, enable half-volatility levels, apply color gradients, customize line styles, widths, label positions, font sizes and offsets.
Flexible Anchor Logic
Set the base line for volatility from Hi/Lo/50%/0% of AXR, or input your own manual price — ideal for ICT model alignment.
Smart Visuals & Optimized Drawing
Clean line and label management using line.new() and label.new() with efficient updates only when required.
Data Table & Summary Panel
Floating table displays key metrics like high/low range, midpoint, volatility settings, and source references.
Built-In Alerts
Receive alerts when price approaches key volatility levels or AXR range extremes — ideal for anticipating institutional behavior.
🛠️ How to Use & Configure
1. Choose the Range Mode
In "AXR Mode & Period Settings", select your preferred range type:
Daily (ADR) – Short-term or intraday.
Weekly (AWR) – Medium swing positions.
Monthly (AMR) – Optimal for higher-timeframe structure.
Quarterly (AQR) – Best for macro-level zones.
Then define the number of days/weeks/months/quarters used to calculate each.
2. Define the Volatility Base Line
Under "Volatility Base Line Settings", configure the anchor:
Use 0% AXR for midpoint, or Hi/Lo/50% for edges.
Manual mode allows custom price input.
Adjust the line color, style, and thickness.
3. Configure Standard Deviation
In "Standard Deviation - Calculation & Levels", select the source:
Automatic AXR — calculates % based on AXR range.
Manual — allows custom % input.
Define how many levels above/below the base line.
Use the scale factor to adjust relative strength (e.g., 0.5 = 50% of AXR).
4. Adjust Visual Display
In "Display & Labels":
Enable or disable volatility lines.
Use color progression for intensity from blue to red.
Show or hide intermediate lines (half deviation).
Choose label alignment: right, center, or left.
Fine-tune label position with candle offset and text size.
5. Extend Lines and Define Visibility
You can choose to extend the lines left, right or both directions — or use a fixed number of bars when not extended.
This applies to both volatility lines and AXR levels.
6. Show AXR Hi/Lo/50%/0% Lines
In "AXR Levels":
Enable display of Hi, Lo, midpoint, and 50% levels.
Toggle display of AXR open levels (MO-based).
Customize style, color and width of each line.
7. Enable the Table (Optional)
Turn on the floating data table to see a quick summary:
Range high/low/midpoint.
Volatility multiplier.
Source (manual vs automatic).
Period length.
Useful for fast review during market sessions.
8. Alerts
Receive automated alerts when price approaches:
AXR Hi/Lo
0% midpoint level
Custom-defined deviation bands
✅ Use Cases
Define and monitor volatility zones around structured ranges.
Combine AMR or AQR with deviation bands for swing setups.
React to price imbalances at 50% or 0% AXR zones.
Integrate with order blocks, liquidity zones or ICT-based confluences.
Questions or suggestions? Contact us via TradingView message or in the comments.
Happy trading!
Sürüm Notları
🚀 MAJOR UPDATE - AXR-VolSD-Loc✨ NEW FEATURES & IMPROVEMENTS
🎯 Enhanced Label Positioning
Right-aligned labels: All volatility labels now positioned at the right end of lines for cleaner chart visualization
Customizable offset: Fine-tune label positioning with the new vela offset control
Improved readability: No more visual interference with price action
🌈 Standardized Volatility Levels System
6 predefined levels: 25%, 50%, 75%, 100%, 150%, 200% above and below the 0% line
Strategic color coding: Each level has a specific color representing its strategic function:
25% (Pullback) - Bright Cyan #00E5FF
50% (Support/Resistance) - Intense Yellow #FFD600
75% (Strong Pullback) - Vibrant Orange #FF9100
100% (Maximum/Minimum) - Neon Green #00FF66 / Vivid Red #FF1744
150% (Tail) - Intense Magenta #F500F5
200% (Extended Tail) - Fluorescent Pink #FF69F0
📊 Smart Labeling System
Strategic function labels: Each level shows its strategic purpose (Pullback, Support, Maximum, etc.)
New format: [Function] [%] - [Price] (e.g., "Support +50% - 1.16254")
Real-time movement: 0% line shows current price movement percentage
Simplified 0% display: Clean format showing only the percentage value in parentheses
⚙️ Optimized Default Settings
Pre-configured for immediate use: Default settings optimized for daily trading
Monthly AMR mode: Set to 6-month calculation period by default
Clean interface: Only essential volatility lines visible by default
Compact table: Shows only critical information (AXR Opening, Calculation Period, 0% Price)
🎨 Visual Enhancements
"Base Line" renamed to "0%": More intuitive terminology throughout the interface
Color progression toggle: Easy switch between standardized colors and custom single color
Improved line styles: Dotted style for 0% line, solid for strategic levels
Better contrast: Optimized colors for dark chart backgrounds (#131722)
📋 Interface Improvements
Reorganized settings groups: More logical grouping of related options
Clearer tooltips: Enhanced descriptions for all configuration options
Streamlined table options: Better control over displayed information
Default ADR period: Changed from 30 to 21 days for better market alignment
🔧 TECHNICAL IMPROVEMENTS
Enhanced Pine Script v6 compatibility: Fully optimized for latest TradingView standards
Improved performance: More efficient calculation and rendering algorithms
Better error handling: Enhanced stability and debugging capabilities
Cleaner code structure: Improved maintainability and future updates
💡 USAGE NOTES
Immediate deployment: Add to chart and start trading - no configuration needed
Full customization: All features remain fully configurable for advanced users
Color progression: Enable "Use Color Progression" to activate the strategic color system
Label positioning: Use the vela offset to fine-tune label placement
Perfect for: Day traders, swing traders, and anyone using volatility-based support/resistance levels for market analysis.
Compatible with: All timeframes and instruments on TradingView.
This update represents months of user feedback integration and extensive testing. Thank you to the trading community for your valuable input!
Sürüm Notları
🚀 MAJOR UPDATE - AXR-VolSD-Loc v2.1 - CHART SCALE SUPPORT✨ REVOLUTIONARY NEW FEATURE
📊 Chart Scale Compatibility
Perfect scale matching: New "Chart Scale" option automatically adjusts calculations to match your chart's scale type
Beginner-friendly interface: Simply choose "Linear" for linear scale charts or "Logarithmic" for log scale charts
One-click accuracy: No complex mathematical knowledge required - just match your chart scale setting
Professional precision: Institutional-grade calculations for both scale types
🎯 How to Use:
Check your chart scale (bottom-left corner in TradingView)
Go to indicator settings → Calculation → "Chart Scale"
Select "Linear" for linear charts or "Logarithmic" for log charts
Enjoy perfectly aligned volatility levels!
🔬 Technical Breakthrough
Why This Matters:
Linear Scale: Traditional calculation - equal price differences appear equal visually
Logarithmic Scale: Proportional calculation - equal percentage moves appear equal visually
Visual Harmony: Volatility levels now perfectly align with your chart's visual proportions
📈 Ideal Applications
Linear Scale Perfect For:
Forex trading (EUR/USD, GBP/USD, etc.)
Traditional stock analysis
Short to medium-term strategies
Stable price range assets
Logarithmic Scale Perfect For:
Cryptocurrency trading (Bitcoin, Ethereum, altcoins)
High-value stocks (AMZN, GOOGL, TSLA)
Long-term investment analysis
Assets with large price variations
🎨 Complete v2.0+ Feature Set
Enhanced User Experience:
Right-aligned labels: Clean, professional chart appearance
6 strategic levels: 25%, 50%, 75%, 100%, 150%, 200% with color-coded functions
Smart labeling: "Pullback +25%", "Support +50%", "Maximum +100%" format
Real-time movement: 0% line shows live price movement percentage
Optimized defaults: Ready-to-use settings for immediate deployment
Strategic Color System:
25% - Pullback (Bright Cyan): Minor retracement zones
50% - Support/Resistance (Intense Yellow): Key decision levels
75% - Strong Pullback (Vibrant Orange): Critical reversal zones
100% - Maximum/Minimum (Green/Red): Extreme movement boundaries
150% - Tail (Magenta): Rare event territories
200% - Extended Tail (Pink): Exceptional market conditions
⚙️ Professional Configuration
Intuitive interface: Beginner-friendly terminology throughout
Advanced options: Full customization for professional traders
Clean defaults: Monthly AMR, 70-bar extension, optimized colors
Table integration: Optional display of active chart scale setting
🔄 Backward Compatibility
Seamless upgrade: Existing configurations automatically preserved
Default behavior: Linear mode maintains original functionality
No disruption: Zero impact on current setups
💡 Pro Tips
Crypto traders: Always use "Logarithmic" for accurate percentage-based levels
Forex traders: "Linear" provides precise pip-based calculations
Multi-timeframe: Switch scales based on analysis timeframe
Backtesting: Use appropriate scale for historical accuracy
🎯 Target Users: All traders from beginners to institutions. Especially valuable for cryptocurrency traders, multi-timeframe analysts, and anyone using logarithmic scale charts.
📊 Compatibility: All TradingView instruments, all timeframes, all chart types.
🔧 Installation: Simply update your existing indicator - all settings preserved automatically.
This update bridges the gap between chart visualization and indicator precision. Finally, an indicator that truly understands your chart scale! Your trading accuracy just got a major upgrade.
Thank you to our trading community for this feature request - your feedback shapes our development priorities!
Sürüm Notları
🚀 CRITICAL UPDATE - AXR-VolSD-Loc v2.1.1 - LABEL CONSISTENCY FIX🔧 IMPORTANT BUG FIX
📊 Fixed: Chart Scale Label Consistency
Critical correction: Labels now remain consistent regardless of chart scale selection
Issue resolved: Logarithmic scale no longer changes percentage labels or strategic function names
Proper behavior: Only price positioning changes between scales, labels stay fixed
✅ What Was Fixed
❌ Previous Behavior (Bug):
Switching to "Logarithmic" scale changed label percentages
"Pullback +25%" became "Pullback +23.7%" (example)
Strategic function names were inconsistent between scales
✅ Current Behavior (Fixed):
Labels always show: 25%, 50%, 75%, 100%, 150%, 200%
Strategic functions remain: "Pullback +25%", "Support +50%", etc.
Only prices change: Lines position correctly for each scale type
🎯 Technical Resolution
Label Mapping Logic:
Fixed percentage system: Labels mapped to predefined percentage array
Consistent indexing: Array structure maintains label integrity
Scale-independent text: Strategic functions and percentages never recalculate
Array Structure Optimization:
Index 0: 0% Line (Base Position)
Index 1: +25% (Pullback), Index 2: -25% (Pullback)
Index 3: +50% (Support), Index 4: -50% (Support)
Index 5: +75% (Strong), Index 6: -75% (Strong)
📈 User Experience Improvements
Predictable Interface:
Same labels everywhere: Regardless of linear or logarithmic scale
Consistent color coding: Colors match fixed percentages, not calculated values
Professional appearance: Clean, standardized labeling system
Strategic Clarity:
25% = Pullback (Always Bright Cyan)
50% = Support/Resistance (Always Intense Yellow)
75% = Strong Pullback (Always Vibrant Orange)
100% = Maximum/Minimum (Always Green/Red)
150% = Tail (Always Magenta)
200% = Extended Tail (Always Pink)
💡 How It Works Now
Linear Scale:
Pullback +25% → Price calculated linearly
Support +50% → Price calculated linearly
Logarithmic Scale:
Pullback +25% → Price calculated logarithmically
Support +50% → Price calculated logarithmically
Result: Same labels, different price positioning based on mathematical precision for your chart scale.
🔄 Backward Compatibility
No settings change required: Update preserves all configurations
Automatic fix: Existing charts immediately show correct labels
Zero disruption: All functionality remains identical
🎯 Recommendation
For all users: This update ensures professional-grade consistency in your volatility analysis. The labeling system now works exactly as intended - providing reliable percentage-based references regardless of your chart scale preference.
Special note for crypto traders: You can now confidently use logarithmic scale knowing your 25%, 50%, 75% levels are truly representative of those percentages, with mathematically precise positioning.
📊 Impact: Enhanced reliability and professional appearance for all volatility-based trading strategies.
🔧 Installation: Simple update - all existing settings automatically preserved.
Thank you to our community for the quick feedback on this critical consistency issue. Your attention to detail helps us maintain the highest standards of precision in our indicators.
Professional trading tools demand professional-grade accuracy. This update delivers exactly that.
Sürüm Notları
FINAL RESULT: Ultra-clean interface with no unnecessary options 0% line always based on 0% AXR (implicit) Optimized and Easier to Use Code New AXR Metrics: ✅ "Half range AXR" ← distance: minimum → point 0 (= point 0 → maximum) ✅ "Total Range AXR" ← Distance: Minimum → Maximum (full range) 3. Display Options: ✅ "Display Half Range AXR?" (default: disabled) ✅ "Display Total Range AXR?" (default: disabled) 100% working build on Pine Script v6 The indicator is now completely simplified and focused on the essentials! 🎯✨Sürüm Notları
📊 CORE FEATURES:Multi-Timeframe Volatility Analysis:
ADR (Average Daily Range) - Daily volatility levels
AWR (Average Weekly Range) - Weekly volatility analysis
AMR (Average Monthly Range) - Monthly volatility patterns
AQR (Average Quarterly Range) - Quarterly volatility trends
🎯 Strategic Level System:
Support/Resistance (±25%) - Key consolidation zones
Target/Stop (±50%) - Primary trading objectives
Extension/Retraction (±75%) - Extended movement levels
Limit (±100%) - Extreme movement boundaries
±150% & ±200% - Ultra-extreme levels for exceptional moves
⚡ Advanced Volatility Calculation:
Daily Volatility Display - Shows average daily movement percentage on the 0% line
Linear & Logarithmic Modes - Choose between equidistant or exponential level spacing
Volatility Multiplier - Adjust level sensitivity (0.1x to 5.0x)
Dynamic Base Position - Use period opening price or current price as reference
🎨 Customization Options:
Full Color Control - Customize base line and level colors with progression
Line Styles - Solid, dashed, or dotted line options
Line Widths - Adjustable thickness for all levels
Label Control - Toggle labels on/off with distance adjustment
3 Extra Custom Lines - Add your own percentage levels with full customization
📋 Information Dashboard:
Compact Data Table - Shows current AXR settings and period information
Flexible Positioning - Place table anywhere on chart
Customizable Appearance - Adjust text size, colors, and transparency
🔧 TECHNICAL IMPROVEMENTS:
Optimized Performance - Efficient calculation and rendering
Clean Code Structure - Professional Pine Script v6 implementation
Multi-Symbol Compatible - Works across all asset classes
Real-time Updates - Dynamic level adjustment as volatility changes
💡 TRADING APPLICATIONS:
Breakout Trading - Identify potential breakout levels
Range Trading - Define consolidation boundaries
Risk Management - Set logical stop-loss and take-profit levels
Volatility Analysis - Understand asset movement patterns
Market Structure - Visualize support and resistance zones
🎯 Perfect for traders who need:
Dynamic support and resistance levels
Volatility-based position sizing
Multi-timeframe analysis
Professional-grade market structure tools
Sürüm Notları
Implementation of the Annual rangeSürüm Notları
AXR-VolSD-Loc Update: Enhanced Table & Label SystemNew Features:
Professional Table Design: Dark theme with unified header and customizable border colors
Enhanced Labels: All volatility lines now display strategic function + percentage + Range identifier + price + volatility increment
New Calculations: Added average price variation percentage and increment values based on selected range period
Improved Display: Central line (0%) shows total variation, other levels show calculated increments per intensity
Table Information:
Var.Med % $: Average percentage variation for the selected range period
Inc (%): Increment value used for volatility level calculations
Customizable: Toggle individual table elements on/off
Border Colors: Configurable border and separator colors
Label Format Examples:
Pullback +25% R - 1.14518, 1.00%
Ponto 0% R – 1.13293, 3.95%
Trava -50% R - 1.10842, 2.00%
Compatible: All existing AXR functionality maintained with Pine Script v6 optimization.
Sürüm Notları
New Features:Extended Volatility Levels: Added 250% and 300% standard levels for deeper analysis
Improved Label Positioning: Labels now stick directly to line endings with no gap, both moved 60 bars right for cleaner charts
Unified Interface Icons: All extra lines now use 📌 (pin) icons for consistent, neutral identification
Enhanced Levels:
Complete range: 25%, 50%, 75%, 100%, 150%, 200%, 250%, 300% (positive/negative)
Strategic functions maintained for core levels
Color-coded progression for quick identification
Visual Improvements:
Ghost Labels: Transparent background with colored text
Sticky Positioning: Labels attach directly to line endpoints
Extended Display: Lines and labels positioned 60 bars right of current price action
Clean Interface: Neutral pin icons replace color-coded circles in settings
Format Example: Pullback +25% R - 1.14518 - 1.00%
Compatible with all existing AXR functionality and Pine Script v6 optimized.
Sürüm Notları
Less direct line and label displacementSürüm Notları
AXR-VolSD-Loc Indicator Update NotesThe latest update to the "AXR-VolSD-Loc" indicator (Pine Script v6) includes the following changes:
Default Color Settings: Updated default colors for better visualization:
Central line (0%): #dbdbdb (full opacity).
Other volatility lines (±25%, ±75%, ±125%, etc.): #b8b8b8 with 50% opacity.
Custom colors (disabled by default):
Maxima (±100%, ±200%, etc.): #4caf50 (green, full opacity).
Minima (-100%, -200%, etc.): #f23645 (red, full opacity).
Intermediate 50% multiples (±50%, ±150%, etc.): #f57c00 (orange, 70% opacity).
Bug Fix: Corrected an error in the f_shouldShowLevel function where showMem was incorrectly referenced. Replaced with showVol400 to ensure proper display of volatility levels between 300% and 400%.
Compilation: Ensured the script compiles without errors or warnings in TradingView, maintaining all existing functionalities (volatility levels, table, alerts, etc.).
These changes enhance visual clarity and resolve the compilation issue, ensuring a seamless experience.
Sürüm Notları
Version Update: AXR-VolSD-Loc IndicatorThis update reorganizes the settings interface for improved usability, based on user feedback. The sections have been reordered as follows:
Base Configuration - AXR
Calculation Parameters (up to Chart Scale)
Center Line (0%)
Level Lines
Volatility Levels Extension
Labels
Line Configuration
Information Table
AXR Data
Technical Data
Debugging
Korumalı komut dosyası
Bu komut dosyası kapalı kaynak olarak yayınlanmaktadır. Ancak, ücretsiz ve herhangi bir sınırlama olmaksızın kullanabilirsiniz – daha fazla bilgiyi buradan edinebilirsiniz.
Feragatname
Bilgiler ve yayınlar, TradingView tarafından sağlanan veya onaylanan finansal, yatırım, alım satım veya diğer türden tavsiye veya öneriler anlamına gelmez ve teşkil etmez. Kullanım Koşulları bölümünde daha fazlasını okuyun.