PROTECTED SOURCE SCRIPT
Tweezer Pattern
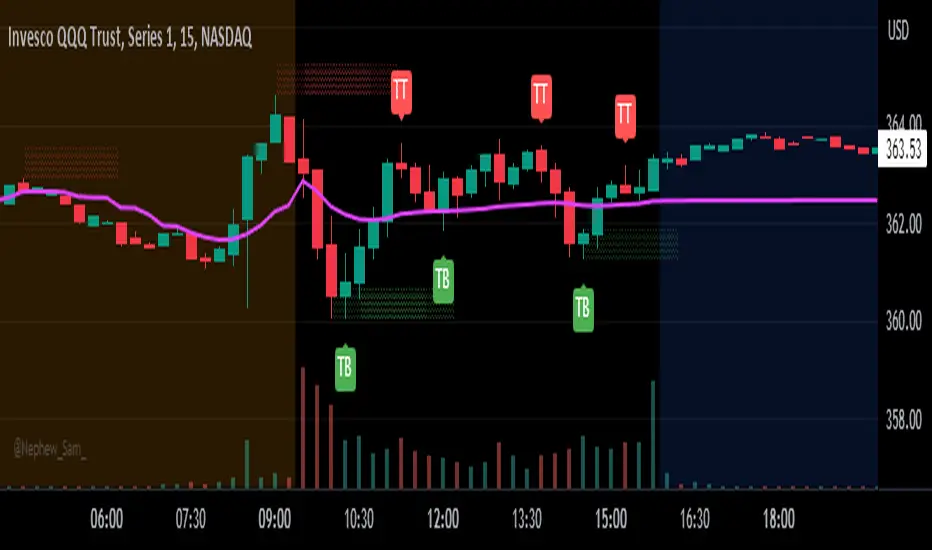
This is a rudimentary indicator to plot tweezer bottoms and tweezer tops. I use this primarily on the 15 minute, but may be applicable to other timeframes.
Criteria for a Tweezer Bottom:
- We were previously in a downtrend (determined by the color of the previous two candles)
- The current candle is green
- The current and previous candle have lower wicks
- The current candle open is approximately the same as the previous candle close (adjustable through settings)
Criteria for a Tweezer Top:
- We were previously in an uptrend (determined by the color of the previous two candles)
- The current candle is red
- The current and previous candle have upper wicks
- The current candle open is approximately the same as the previous candle close (adjustable through settings)
Potential Improvements:
- Determine trend through TA, for example using SMAs
- Ensure wick length as some percentage of candle height instead of just checking for existence
- Ensure tweezer candle is large or has some required minimum volume to reduce false positives
For any improvements or ideas, feel free to contact me :)
Korumalı komut dosyası
Bu komut dosyası kapalı kaynak olarak yayınlanmaktadır. Ancak, ücretsiz ve herhangi bir sınırlama olmaksızın kullanabilirsiniz – daha fazla bilgiyi buradan edinebilirsiniz.
Feragatname
Bilgiler ve yayınlar, TradingView tarafından sağlanan veya onaylanan finansal, yatırım, alım satım veya diğer türden tavsiye veya öneriler anlamına gelmez ve teşkil etmez. Kullanım Koşulları bölümünde daha fazlasını okuyun.