OPEN-SOURCE SCRIPT
Volume Bomb
I am republishing to use a clean chart. Previous one had too much of a mess. Idea for TradingView: Please allow us to change out the charts after publishing.
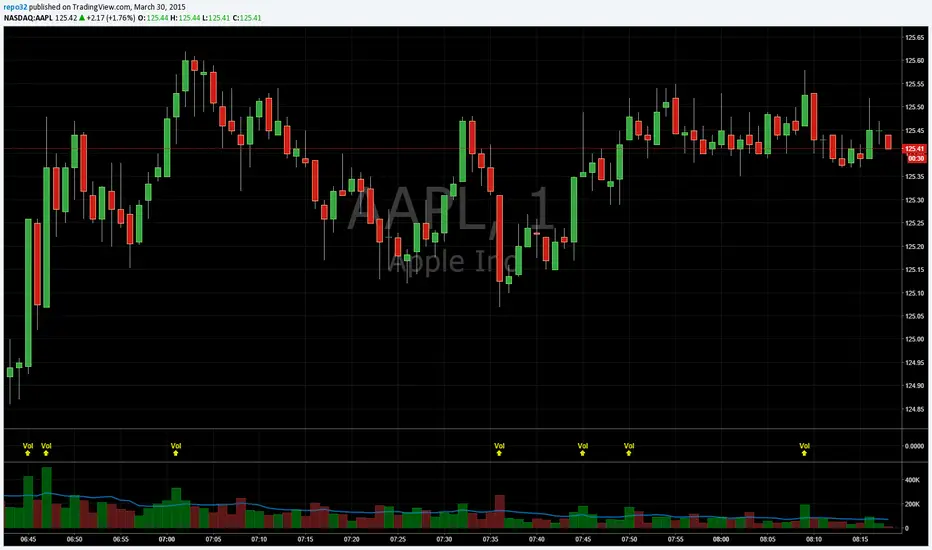
I like to know when volume spikes (only when it spikes). I am not interested in seeing the rest of the volume bars. I created this indicator to show me when it explodes (i.e. the name "Volume Bomb" , plus it sounds cool).
This indicator only shows you when volume exceeds the EMA of volume by whatever multiplier you set.
Default settings are the current volume with 10 EMA. Yellow arrowup will appear when volume is at 1.5x the 10 EMA.
Adjust it to your liking and particular stock.
Açık kaynak kodlu komut dosyası
Gerçek TradingView ruhuna uygun olarak, bu komut dosyasının oluşturucusu bunu açık kaynaklı hale getirmiştir, böylece yatırımcılar betiğin işlevselliğini inceleyip doğrulayabilir. Yazara saygı! Ücretsiz olarak kullanabilirsiniz, ancak kodu yeniden yayınlamanın Site Kurallarımıza tabi olduğunu unutmayın.
Feragatname
Bilgiler ve yayınlar, TradingView tarafından sağlanan veya onaylanan finansal, yatırım, işlem veya diğer türden tavsiye veya tavsiyeler anlamına gelmez ve teşkil etmez. Kullanım Şartları'nda daha fazlasını okuyun.