OPEN-SOURCE SCRIPT
Güncellendi Healthcheck v1
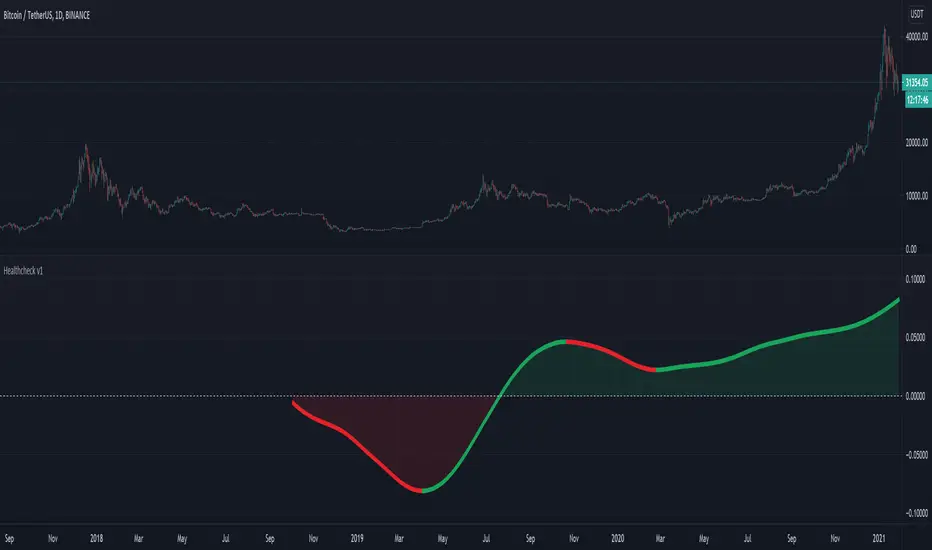
This indicator shows us if the coin is closing more above (green) or under (red) the EMA 200.
The more the price close above the EMA the healthier the currency (other market) is and the more i am likely to invest in.
HOW TO USE:
Set the desired EMA and HMA length.
Markets:
It can be used to all markets.
The more the price close above the EMA the healthier the currency (other market) is and the more i am likely to invest in.
HOW TO USE:
Set the desired EMA and HMA length.
Markets:
It can be used to all markets.
Sürüm Notları
Added a line to indicate if the trend is going up or down. Red line: trend is going downward
Green line: trend is going upward
Sürüm Notları
Now it usess the Boilinger Band mainband instead of the EMA 200.Açık kaynak kodlu komut dosyası
Gerçek TradingView ruhuyla, bu komut dosyasının mimarı, yatırımcıların işlevselliğini inceleyip doğrulayabilmesi için onu açık kaynaklı hale getirdi. Yazarı tebrik ederiz! Ücretsiz olarak kullanabilseniz de, kodu yeniden yayınlamanın Topluluk Kurallarımıza tabi olduğunu unutmayın.
Feragatname
Bilgiler ve yayınlar, TradingView tarafından sağlanan veya onaylanan finansal, yatırım, alım satım veya diğer türden tavsiye veya öneriler anlamına gelmez ve teşkil etmez. Kullanım Koşulları bölümünde daha fazlasını okuyun.
Açık kaynak kodlu komut dosyası
Gerçek TradingView ruhuyla, bu komut dosyasının mimarı, yatırımcıların işlevselliğini inceleyip doğrulayabilmesi için onu açık kaynaklı hale getirdi. Yazarı tebrik ederiz! Ücretsiz olarak kullanabilseniz de, kodu yeniden yayınlamanın Topluluk Kurallarımıza tabi olduğunu unutmayın.
Feragatname
Bilgiler ve yayınlar, TradingView tarafından sağlanan veya onaylanan finansal, yatırım, alım satım veya diğer türden tavsiye veya öneriler anlamına gelmez ve teşkil etmez. Kullanım Koşulları bölümünde daha fazlasını okuyun.