OPEN-SOURCE SCRIPT
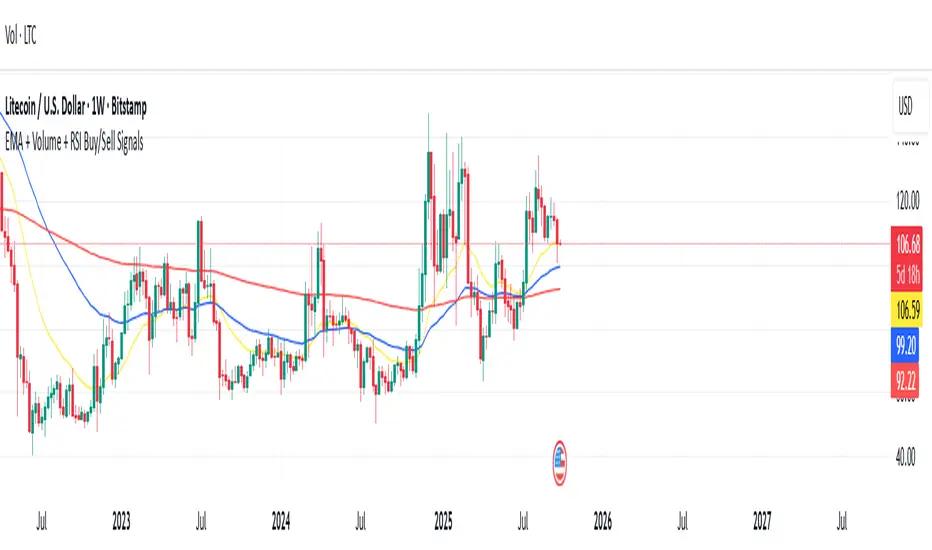
EMA + Volume + RSI Buy/Sell Signals
//version=5
indicator("EMA + Volume + RSI Buy/Sell Signals", overlay=true)
// === Inputs ===
ema20 = ta.ema(close, 20)
ema50 = ta.ema(close, 50)
ema200 = ta.ema(close, 200)
rsi = ta.rsi(close, 14)
// === Conditions ===
// Price % change from yesterday
priceChange = (close - close[1]) / close[1] * 100
// Volume condition
volCondition = volume > 1.5 * volume[1]
// RSI
rsiOverbought = rsi > 70
rsiOversold = rsi < 30
// Price move conditions
priceUp5 = priceChange > 5
priceDown5 = priceChange < -5
// === Buy & Sell Conditions ===
buySignal = close > ema20 and close > ema50 and close > ema200 and priceUp5 and volCondition and rsiOversold
sellSignal = close < ema20 and close < ema50 and close < ema200 and priceDown5 and volCondition and rsiOverbought
// === Plot EMAs ===
plot(ema20, color=color.yellow, title="EMA 20")
plot(ema50, color=color.blue, title="EMA 50")
plot(ema200, color=color.red, title="EMA 200")
// === Plot Signals on Chart ===
plotshape(buySignal, title="BUY Signal", style=shape.labelup, color=color.green, text="BUY", location=location.belowbar, size=size.normal)
plotshape(sellSignal, title="SELL Signal", style=shape.labeldown, color=color.red, text="SELL", location=location.abovebar, size=size.normal)
// === Background Highlight for Visuals ===
bgcolor(buySignal ? color.new(color.green, 85) : na)
bgcolor(sellSignal ? color.new(color.red, 85) : na)
Açık kaynak kodlu komut dosyası
Gerçek TradingView ruhuna uygun olarak, bu komut dosyasının oluşturucusu bunu açık kaynaklı hale getirmiştir, böylece yatırımcılar betiğin işlevselliğini inceleyip doğrulayabilir. Yazara saygı! Ücretsiz olarak kullanabilirsiniz, ancak kodu yeniden yayınlamanın Site Kurallarımıza tabi olduğunu unutmayın.
Feragatname
Bilgiler ve yayınlar, TradingView tarafından sağlanan veya onaylanan finansal, yatırım, işlem veya diğer türden tavsiye veya tavsiyeler anlamına gelmez ve teşkil etmez. Kullanım Şartları'nda daha fazlasını okuyun.