OPEN-SOURCE SCRIPT
Güncellendi Normalized Fibonacci Retracement (MTF/LOG)
A question: Instead of creating indicators that constantly plot Fibonacci Retracement levels in a visually overwhelming way, why don't we redefine them on a different scale? 🤨
Overview
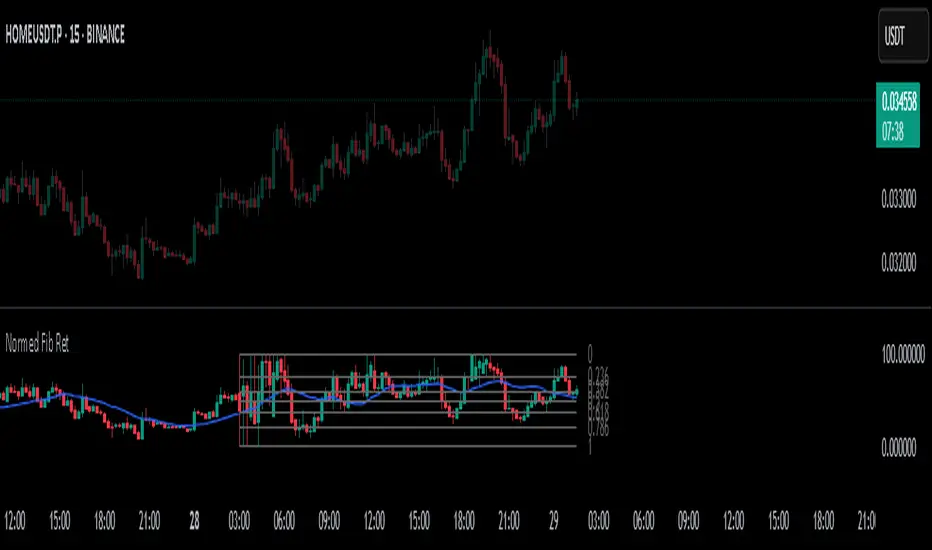
The Normalized Fibonacci Retracement indicator converts price data to a 0-100 scale based on the selected timeframe's high-low range, displaying normalized candlesticks alongside standard Fibonacci levels (23.6%, 38.2%, 50%, 61.8%, 78.6%). This normalization reveals patterns that may be hidden in absolute price charts and allows consistent analysis across different instruments.
Originality
By normalizing prices to percentages, this indicator enables pattern recognition independent of absolute price levels. The same formation at $10-$20 and $1000-$2000 appears identical on the normalized scale, helping traders identify recurring structures across various assets and timeframes.
Concepts
The indicator uses a simple formula to transform price data into percentages. This creates a bounded scale where patterns become comparable regardless of the underlying asset's price range. The normalized view often reveals symmetries and relationships not visible in traditional price charts.
Mechanics
The system tracks highs and lows within the selected timeframe as anchor points. When a new period begins, fresh boundaries are established and prices recalculated. Trend direction is determined by timing of extremes. Linear scaling uses direct percentage calculation, while logarithmic scaling applies exponential interpolation for assets with large percentage moves.
Functions
Notes
Ensure chart data covers the full selected timeframe for accurate calculations. Use logarithmic scaling for volatile assets with large percentage moves. The normalized scale is effective at revealing patterns and structures that remain consistent across different price ranges, making it particularly useful for comparative analysis and pattern-based trading strategies.
I hope it helps everyone. Do not forget to manage your risk. And trade as safely as possible. Best of luck!
Overview
The Normalized Fibonacci Retracement indicator converts price data to a 0-100 scale based on the selected timeframe's high-low range, displaying normalized candlesticks alongside standard Fibonacci levels (23.6%, 38.2%, 50%, 61.8%, 78.6%). This normalization reveals patterns that may be hidden in absolute price charts and allows consistent analysis across different instruments.
Originality
By normalizing prices to percentages, this indicator enables pattern recognition independent of absolute price levels. The same formation at $10-$20 and $1000-$2000 appears identical on the normalized scale, helping traders identify recurring structures across various assets and timeframes.
Concepts
The indicator uses a simple formula to transform price data into percentages. This creates a bounded scale where patterns become comparable regardless of the underlying asset's price range. The normalized view often reveals symmetries and relationships not visible in traditional price charts.
Mechanics
The system tracks highs and lows within the selected timeframe as anchor points. When a new period begins, fresh boundaries are established and prices recalculated. Trend direction is determined by timing of extremes. Linear scaling uses direct percentage calculation, while logarithmic scaling applies exponential interpolation for assets with large percentage moves.
Functions
- Timeframe Selection: Higher timeframe analysis on any chart resolution
- Normalized Display: OHLC data converted to 0-100 percentage scale
- Fibonacci Levels: Standard retracement levels plotted automatically
- Scaling Options: Linear or logarithmic calculation methods
- Pattern Recognition: Reveals formations hidden in absolute price charts
- Moving Average: Optional 20-period SMA overlay
Notes
Ensure chart data covers the full selected timeframe for accurate calculations. Use logarithmic scaling for volatile assets with large percentage moves. The normalized scale is effective at revealing patterns and structures that remain consistent across different price ranges, making it particularly useful for comparative analysis and pattern-based trading strategies.
I hope it helps everyone. Do not forget to manage your risk. And trade as safely as possible. Best of luck!
Sürüm Notları
UPDATE NOTES- Variables belonging to old calculations in the script have been cleaned up (e.g., "grd", "grc", "duration")
- Array design has been updated. Unnecessary array shifting logic has been removed; "term" variable and "rf"-based redundant calculations have been cleaned up.
- Color and appearance properties of plotted outputs have been made user-defined, and tooltips have been added for inputs.
EXPANDED INDICATOR DESCRIPTIONS
Overview
This indicator normalizes price data and calculates Fibonacci Retracement levels based on this normalized data, providing a cleaner and more precise analysis environment. By automatically detecting the highest and lowest prices within the selected timeframe and normalizing OHLC values between 0-100, it eliminates market noise and allows traders to observe price behavior patterns and Fibonacci level interactions more clearly. The indicator works entirely automatically - users simply need to select their preferred timeframe and calculation method (linear or logarithmic) to get started.
What is This Indicator?
I had previously published an Anchored/MTF version of Fibonacci Retracement. Following the interest in that indicator, I decided to publish this indicator as well to offer a different perspective on the Retracement concept.
Retracement levels are an effective support-resistance mechanism and are frequently used in financial markets. Retracement levels are a commonly referenced tool for explaining price movements and identifying reversal levels. This indicator, in short, normalizes price and calculates Fibonacci Retracement levels based on this normalized data.
How Does This Indicator Work?
The working mechanism of the indicator is simple. To draw classic Fibonacci Retracement levels, we need the highest and lowest prices seen within a specified length (in this indicator, the length is determined according to the selected timeframe). This indicator automatically detects the highest and lowest prices in the specified timeframe and determines direction according to the formation sequence (priority/posteriority relationship) of these prices. For example, let's assume we select the timeframe as 1 day. If the lowest price seen during the day occurred before the highest price, the direction of Fibonacci Retracement is from bottom to top. If the opposite is true, the direction will be from top to bottom. Depending on the direction determination, levels (23.6%, 38.2%, 50%, 61.8%, 78.6%) are constructed.
After the levels are calculated, the normalization process begins. Normalization is the redefinition of any data's values seen within a certain length to vary between 0 and 100. In this indicator, the normalization length is determined according to the selected timeframe, just like in Retracement levels. The data being normalized is directly the price itself (OHLC).
How to Use This Indicator?
The indicator performs this process completely automatically. The only thing the user needs to do is determine the timeframe and specify the calculation preference (linear or logarithmic). Optionally, a simple moving average defined over a user-specified length can also be displayed (The data used as the source for the average is the normalized close price).
What Does This Indicator Do and What Are Its Original Features?
In addition to the analysis capabilities that classic Fibonacci levels provide us, we can summarize the advantages of using this indicator in three points:
- Thanks to normalization, we can observe much more clearly which Fibonacci Level the price has touched most in the past and make our decisions accordingly. This feature offers a much more effective and clean solution compared to equivalent indicators that often repaint.
- We can detect Chart Formations and pattern analyses much more clearly. Price normalization absorbs anomalies characterized as 'noise' and the price's behavior pattern can be analyzed more clearly.
- The calculation method in the open-source code is adaptable not only for Retracement levels but also for all kinds of channel and band systems.
Final Thoughts
Support-Resistance indicators do not promise direct trading signals to the user. The user is completely free to decide which direction to trade based on which level the price intersects with or converges to. If there is demand, I can add alarm options in future versions as well.
Since there is no similar work on TradingView, I wanted to publish this script, I hope it benefits everyone.
Açık kaynak kodlu komut dosyası
Gerçek TradingView ruhuyla, bu komut dosyasının mimarı, yatırımcıların işlevselliğini inceleyip doğrulayabilmesi için onu açık kaynaklı hale getirdi. Yazarı tebrik ederiz! Ücretsiz olarak kullanabilseniz de, kodu yeniden yayınlamanın Topluluk Kurallarımıza tabi olduğunu unutmayın.
Feragatname
Bilgiler ve yayınlar, TradingView tarafından sağlanan veya onaylanan finansal, yatırım, alım satım veya diğer türden tavsiye veya öneriler anlamına gelmez ve teşkil etmez. Kullanım Koşulları bölümünde daha fazlasını okuyun.