PROTECTED SOURCE SCRIPT
JJ/CG - Dynamic Mean Reversion Indicator with Candle Size Filter
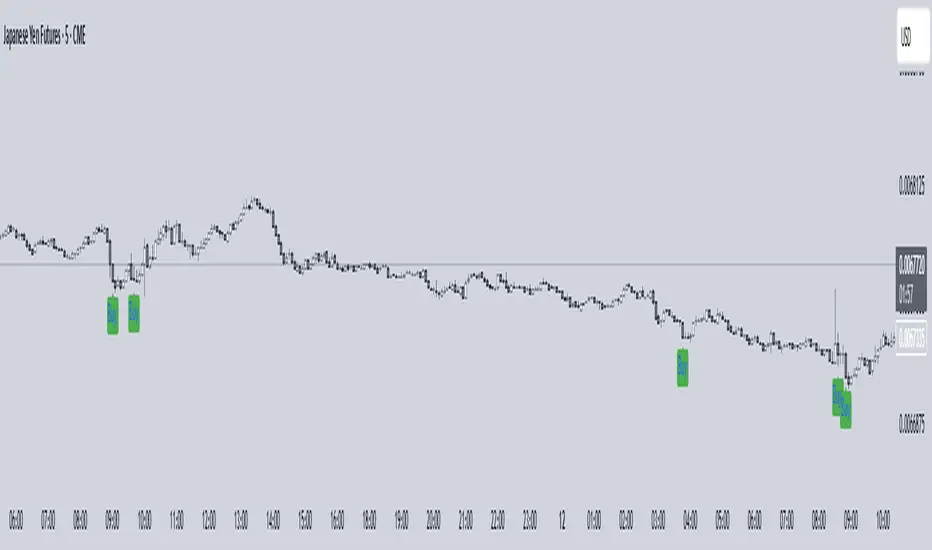
Dynamic Mean Reversion Indicator (DMR 250 EMA)
📌 Best Timeframes: 5m / 15m / 1hr
📊 Works on All Markets: Crypto, Forex, Stocks, Commodities
How It Works (Based on Script)
This indicator is built around the 250 EMA (Exponential Moving Average) and tracks price movements in relation to it. It identifies extreme price deviations and detects when price has moved too far from the EMA, signaling potential reversion points.
🔹 Core Components:
250 EMA as a Baseline
The script calculates a 250-period EMA, which acts as a dynamic trend guide.
Price Deviation Calculation
The script measures the absolute difference between price and the 250 EMA.
It tracks the highest deviation over a set lookback period (default: 1000 candles).
A dynamic threshold is created based on the highest historical deviation, multiplied by a user-defined factor (default: 0.85).
Candle Size Filter
The script calculates the average candle size over a lookback period (default: 50 candles).
If a candle is significantly larger than the average (based on a multiplier, default: 2.0x), it is flagged as an important move.
Long & Short Signal Conditions
Long Signal (Buy Signal):
Price is significantly below the EMA (beyond the dynamic threshold).
A large candle is present.
Short Signal (Sell Signal):
Price is significantly above the EMA (beyond the dynamic threshold).
A large candle is present.
Alerts & Visuals
When conditions are met, the script plots "Buy" signals below the price and "Sell" signals above the price.
Users can set up alerts to get notified when a signal occurs.
How to Use It
Price tends to revert to the 250 EMA after extreme deviations.
Use this indicator with support/resistance levels, RSI, and Stochastic for confirmation.
Best used in volatile markets where price moves sharply away from the mean.
⚠ Not a standalone indicator – combine with other tools for better accuracy! 🚀ator – use it with RSI, Stochastic, and solid TA for best results! 🚀
Korumalı komut dosyası
Bu komut dosyası kapalı kaynak olarak yayınlanmaktadır. Ancak, ücretsiz ve herhangi bir sınırlama olmaksızın kullanabilirsiniz – daha fazla bilgiyi buradan edinebilirsiniz.
Feragatname
Bilgiler ve yayınlar, TradingView tarafından sağlanan veya onaylanan finansal, yatırım, alım satım veya diğer türden tavsiye veya öneriler anlamına gelmez ve teşkil etmez. Kullanım Koşulları bölümünde daha fazlasını okuyun.