OPEN-SOURCE SCRIPT
Drawdown and Drawback || Ranging
Hey!
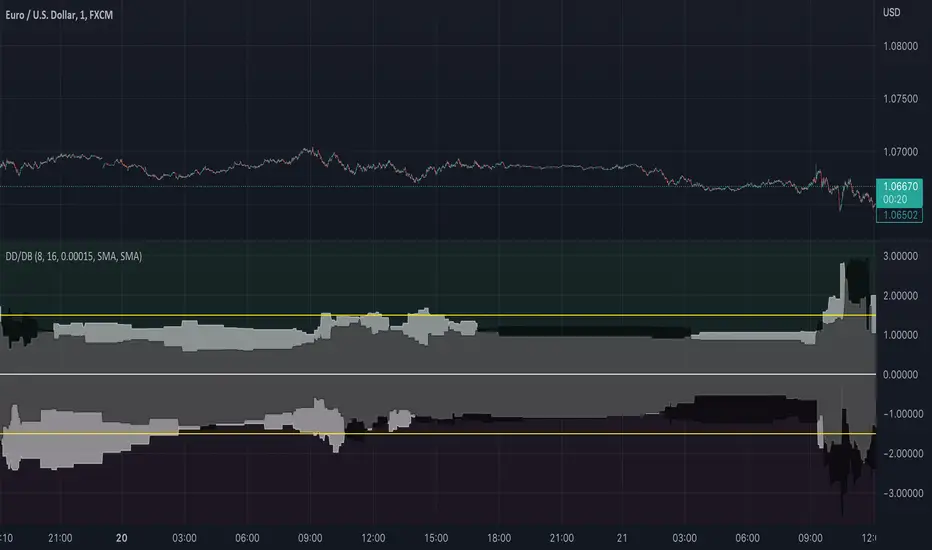
So this indicator tries to spot ranges;
Above the zero line is the data from green candles and below the zero line is the data from the red candles;
When the white area is > than the black area, it indicates that the DrawBack is higher than the DrawDown;
This might work counterintuitively for some people because, for a bullish candle, this means it has to go down for the indicator to recognize it as “good”/ see it as a DrawBack value;
The same is true for a bearish candle, the price has to move up after for it to be seen as a DrawBack value;
There are a few input values:
Length_: This is how many bars a candle gets for the price to move in, the default is 8 bars, so after a bar is formed, from the following 8 bars the DrawBack/DrawDown is saved;
EMA_Length: This is the EMA length, you can change the EMA length and also the MA variant, so you have full flexibility about what might work best for you;
RB_Size: This is how many points a Real Body of a candle has to have before it gets registered within the indicator, what I found it, is that if you put this too low your data gets ruined by candles that have 1-5 points if you use it on a low TimeFrame, but if you want to use it on higher timeframes you maybe have to make the default a bit higher.
Everything is plotted with an Offset of 1, I like it this way so you get a realistic view of the market as you will -most likely- place trades on the next candle either way not on the current candle. But that is just my opinion.
I also added 2 yellow Hlines for visual purposes to see if they were within a certain boundary, see if these add anything for yourself, because they can also make it look a bit messy;
If you have any questions about the code or the indicator itself, feel free to ask them!
I hope it helps at least one person ;)
Açık kaynak kodlu komut dosyası
Gerçek TradingView ruhuyla, bu komut dosyasının mimarı, yatırımcıların işlevselliğini inceleyip doğrulayabilmesi için onu açık kaynaklı hale getirdi. Yazarı tebrik ederiz! Ücretsiz olarak kullanabilseniz de, kodu yeniden yayınlamanın Topluluk Kurallarımıza tabi olduğunu unutmayın.
Feragatname
Bilgiler ve yayınlar, TradingView tarafından sağlanan veya onaylanan finansal, yatırım, alım satım veya diğer türden tavsiye veya öneriler anlamına gelmez ve teşkil etmez. Kullanım Koşulları bölümünde daha fazlasını okuyun.