OPEN-SOURCE SCRIPT
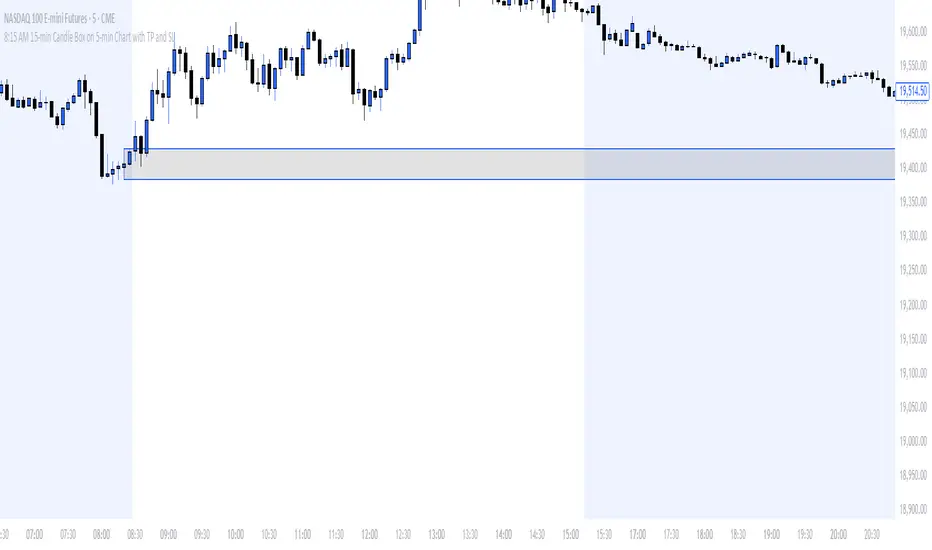
8:15 AM 15-min Candle Box on 5-min Chart with TP and SL

The “8:15 AM 15-min Candle Box on 5-min Chart with TP and SL” indicator is a custom-built Pine Script tool for breakout trading strategies, particularly tailored for assets like NASDAQ Futures (NAS100) during the U.S. market pre-open.
🔍 What It Does:
Tracks the 8:15–8:30 AM Central Time (CDT) Candle:
It marks the high and low of the 15-minute candle that starts at 8:15 AM (CDT).
The box visually outlines this price range.
Draws a Breakout Box:
At 8:30 AM, a box is drawn from the 8:15 candle’s high and low.
The box stretches forward 8 hours into the session, helping you visualize price interaction with that range.
Detects Breakouts:
If the price closes above the high, it signals a buy breakout.
If it closes below the low, it signals a sell breakout.
Automatically Calculates TP and SL:
Take Profit (TP): 50 pips from the breakout level in the direction of the trade.
Stop Loss (SL): 40 pips in the opposite direction.
Pips are calculated using the symbol’s minimum tick size.
Color Feedback:
Box turns green on a buy breakout, red on a sell breakout.
If TP is reached, the box turns black.
If SL is hit, the box turns purple.
🧠 Why Use This Indicator:
Perfect for pre-market breakout traders who want a visual confirmation of price action around the U.S. market open.
Provides a clear entry range, trade direction, and risk/reward visual cue.
No manual drawing — everything is automated daily based on reliable timing.
Would you like a version with alerts or plotted TP/SL lines as well?
Açık kaynak kodlu komut dosyası
Gerçek TradingView ruhuyla, bu komut dosyasının mimarı, yatırımcıların işlevselliğini inceleyip doğrulayabilmesi için onu açık kaynaklı hale getirdi. Yazarı tebrik ederiz! Ücretsiz olarak kullanabilseniz de, kodu yeniden yayınlamanın Topluluk Kurallarımıza tabi olduğunu unutmayın.
Feragatname
Bilgiler ve yayınlar, TradingView tarafından sağlanan veya onaylanan finansal, yatırım, alım satım veya diğer türden tavsiye veya öneriler anlamına gelmez ve teşkil etmez. Kullanım Koşulları bölümünde daha fazlasını okuyun.