Market phases 2.0
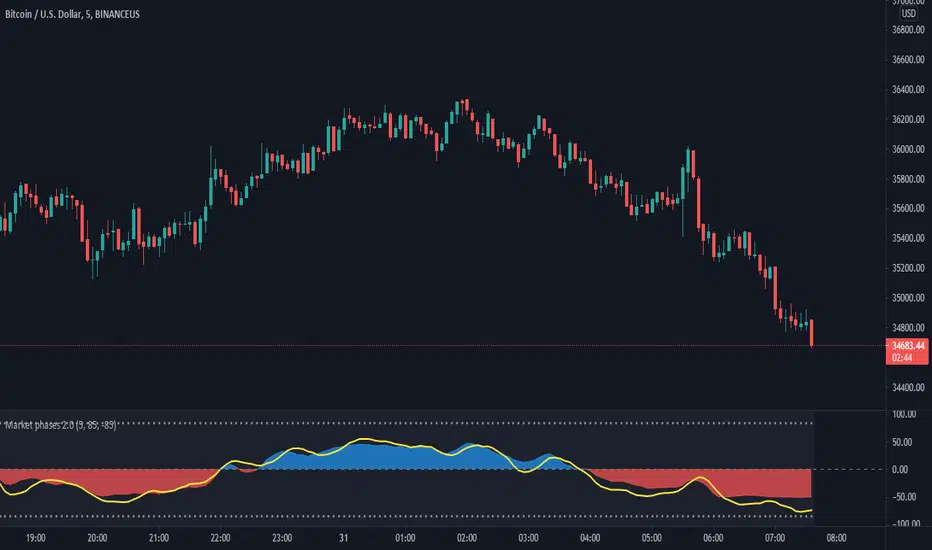
1) The TREND OSCILLATOR: This trend oscillator indicates the trend of the stock/instrument. It is calculated on the basis of number of positive candles or negative candles formed during a specific period.
The oscillator oscillates around the zero horizontal line. The trend is considered bullish if the oscillator value is positive and the trend is considered negative if the oscillator value is negative.
2) The MOMENTUM OSCILLATOR:
The momentum oscillator indicates the short term momentum of the stock/instrument. It is calculated on the rate of change of close price for a specific period in the past.
The Momentum oscillator oscillates around the zero horizontal line. If the momentum oscillator has a positive value, the momentum is considered to be on the bullish side and similarly if the momentum oscillator has a negative value, the momentum is considered to be on the bearish side.
3) The SIGNAL LINE: The signal line is represented by the yellow color line. The Signal line combines the value of the Trend oscillator and the Momentum oscillator. The signal also moves around the zero line. There are two dotted lines above and below the zero line.
When the signal line crosses the upper dotted line, it indicates that the stock/instrument has moved on the upper side too quickly or sharply and the ongoing move may not continue for long. It may also be considered as overbought at that point. A red triangle appears at that point.
Similarly, when the signal line crosses the lower dotted line, it indicates that the stock/instrument has moved on the downside too quickly or sharply and the ongoing down move may not continue for long. It may also be considered as oversold at that point. A green triangle appears at that point.
The values for the look back period of the signal line and the values for the upper range and lower range of the indicator can be changed by going to the settings of the indicator.
***Disclaimer: The market movement depends upon a lot of factors which are beyond the scope of this indicator. Hence the indicator may display results not intended on rare occasions.
Trading in the markets involves involves huge risks and one should always follow his/her own research before taking any trading decisions.
**The MOMENTUM OSCILLATOR is represented by the color grey.
**The TREND OSCILLATOR is represented by the colors blue/red.
**The two dotted lines placed at the values 85 and -85 are the the upper range and lower range of the indicator respectively.
Yalnızca davetli komut dosyası
Only users approved by the author can access this script. You'll need to request and get permission to use it. This is typically granted after payment. For more details, follow the author's instructions below or contact skynet970 directly.
TradingView, yazarına tam olarak güvenmediğiniz ve nasıl çalıştığını anlamadığınız sürece bir komut dosyası için ödeme yapmanızı veya kullanmanızı ÖNERMEZ. Ayrıca topluluk komut dosyaları bölümümüzde ücretsiz, açık kaynaklı alternatifler bulabilirsiniz.
Yazarın talimatları
Uyarı: Erişim talebinde bulunmadan önce lütfen yalnızca davetli komut dosyaları kılavuzumuzu okuyun.
Feragatname
Yalnızca davetli komut dosyası
Only users approved by the author can access this script. You'll need to request and get permission to use it. This is typically granted after payment. For more details, follow the author's instructions below or contact skynet970 directly.
TradingView, yazarına tam olarak güvenmediğiniz ve nasıl çalıştığını anlamadığınız sürece bir komut dosyası için ödeme yapmanızı veya kullanmanızı ÖNERMEZ. Ayrıca topluluk komut dosyaları bölümümüzde ücretsiz, açık kaynaklı alternatifler bulabilirsiniz.
Yazarın talimatları
Uyarı: Erişim talebinde bulunmadan önce lütfen yalnızca davetli komut dosyaları kılavuzumuzu okuyun.