PROTECTED SOURCE SCRIPT
Güncellendi 4-EMA Trend

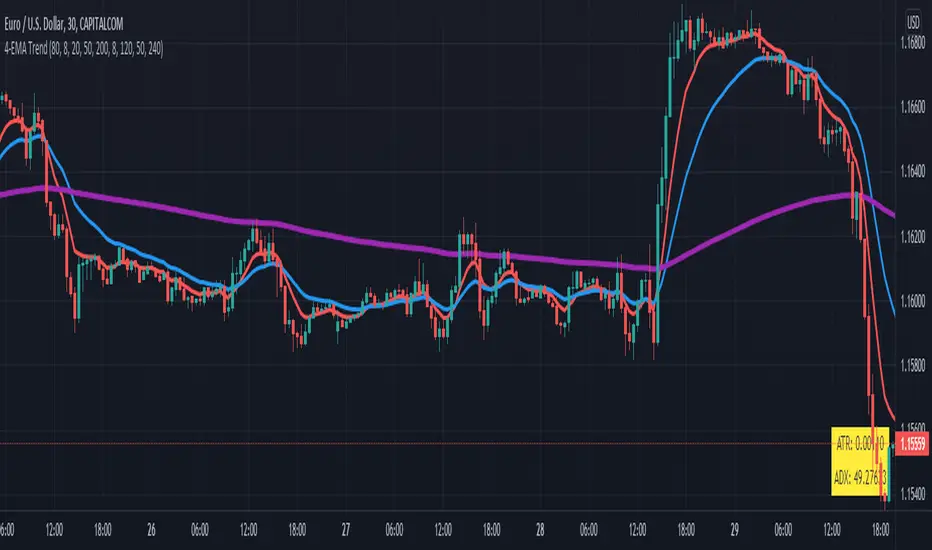
This indicator can be used to visualize when price is above or below special exponential moving averages (8, 21, 50 and 200) that are also displayed on the chart. A green or red background is plotted then, that can be followed as a trend. You can define the amount of risk (e.g. in $) and the number of previous bars that will be used to calculate the stop loss. For the stop loss a label is shown (long or short) that displays the quantity to buy or sell for your defined risk. It is recommend to use the indicator in combination with my Stochastic & RSI (see chart) to enter trades long or short when stochastic is overbought or oversold and RSI above or below 50.
 US100
US100
Sürüm Notları
Update trend indication: ema8 has to be above / below slower emaSürüm Notları
EMA description and length adjustedSürüm Notları
Show stop loss buy or sell depending price above or below slowest EMASürüm Notları
SMA 40 added as special pullback indicatorSürüm Notları
Added alerts for long or short trend changeSürüm Notları
Add MTF support for slow EMAsSürüm Notları
SMA replaced by EMA for trend detectionSürüm Notları
Length of EMAs can be setSürüm Notları
MTF EMA not displayed by default, 20, 50, 200 ema default lengthSürüm Notları
ATR Stop added as dots (bullish, bearish)Sürüm Notları
Input option for ema fast and middle lengthSürüm Notları
EMA Ribbon added with option to hide itSürüm Notları
Alert when price is close to trend EMA (default 200 EMA)Sürüm Notları
Performance improved, ema ribbon removedSürüm Notları
TEMA for trend includedSürüm Notları
TEMA with custom length, pine version 5Sürüm Notları
Refactoring and 4th ema addedSürüm Notları
ATR stoploss multiplier addedSürüm Notları
Added real price display for Heikin Ashi chart typeSürüm Notları
Labels for engulfing candles addedSürüm Notları
Engulfing pattern bug fixedSürüm Notları
Barcolor for engulfing addedSürüm Notları
Engulging candles added and atr to 10Sürüm Notları
Volatility Stop Length addedSürüm Notları
Inside bar added as candlestick patternSürüm Notları
Inside bar without colorKorumalı komut dosyası
Bu komut dosyası kapalı kaynak olarak yayınlanmaktadır. Ancak, ücretsiz ve herhangi bir sınırlama olmaksızın kullanabilirsiniz – daha fazla bilgiyi buradan edinebilirsiniz.
Access our indicators from: indivisionx.com
Feragatname
Bilgiler ve yayınlar, TradingView tarafından sağlanan veya onaylanan finansal, yatırım, alım satım veya diğer türden tavsiye veya öneriler anlamına gelmez ve teşkil etmez. Kullanım Koşulları bölümünde daha fazlasını okuyun.
Korumalı komut dosyası
Bu komut dosyası kapalı kaynak olarak yayınlanmaktadır. Ancak, ücretsiz ve herhangi bir sınırlama olmaksızın kullanabilirsiniz – daha fazla bilgiyi buradan edinebilirsiniz.
Access our indicators from: indivisionx.com
Feragatname
Bilgiler ve yayınlar, TradingView tarafından sağlanan veya onaylanan finansal, yatırım, alım satım veya diğer türden tavsiye veya öneriler anlamına gelmez ve teşkil etmez. Kullanım Koşulları bölümünde daha fazlasını okuyun.