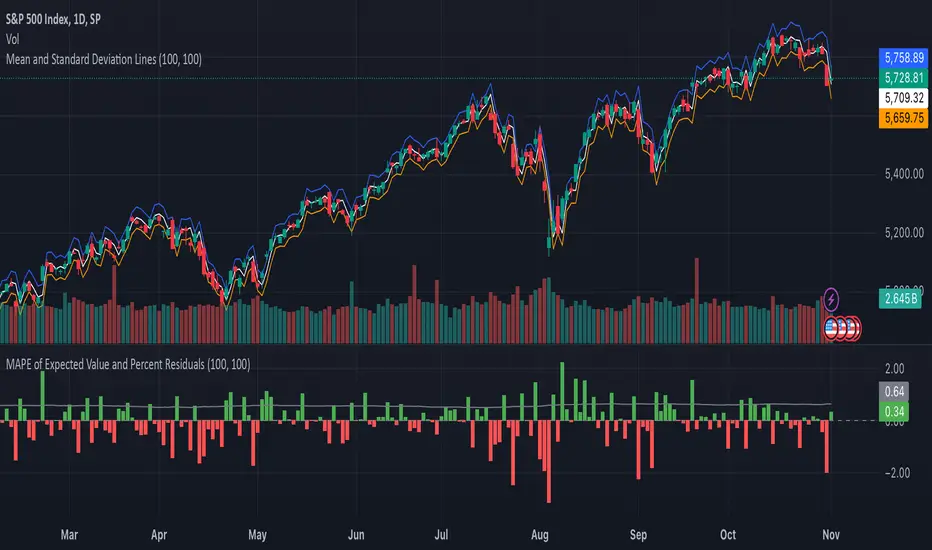
MAPE of Expected Value and Percent Residuals

This indicator calculates and visualizes the Mean Absolute Percentage Error (MAPE) and the percent residuals of the expected value compared to the actual closing price. The purpose of this indicator is to provide insights into the accuracy of price forecasts by comparing predicted values to actual market outcomes. The expected values are derived from the transform model, which uses the mean line from the mean and standard deviation lines as an indicator for expected price movement. Users can customize the number of periods over which calculations are averaged.
Inputs
- Mean Period (Bars): Specifies the number of bars used to calculate the moving average of the change between closing prices. This value should match the value used in the mean and standard deviation lines indicator.
- MAPE Period (Bars): Specifies the number of bars used to calculate the moving average of the absolute percentage error.
Outputs
- Percent Residuals Histogram: Displays the percentage error between the predicted (expected) value and the actual closing price. The bars are color-coded, with green indicating positive residuals (i.e., the actual value is higher than the predicted value) and red indicating negative residuals (i.e., the actual value is lower than the predicted value).
- Reference Line: A horizontal line at zero is added to the chart to indicate the baseline for percent residuals.
- Mean Absolute Percentage Error (MAPE) Line: Plots the moving average of the absolute percentage error over the specified period, helping users gauge the average accuracy of their predictions over time.
Methodology
- Calculation of Individual Bar Normalized Residuals: The normalized residuals for each bar are computed by taking the difference between the actual closing price and the predicted (expected) value, divided by the closing price. If the actual closing price is above the expected value, the residual is considered positive and is represented in green; otherwise, it is negative and represented in red. This normalization provides a standardized measure of deviation that allows for consistent comparison across different bars.
- Mean Absolute Percentage Error (MAPE) Calculation: Over the user-defined period, the absolute values of the normalized residuals are computed and subsequently averaged to determine the Mean Absolute Percentage Error (MAPE). This metric quantifies the average magnitude of the forecast errors, providing a clear indication of the model's predictive accuracy over time.
How to Use
- Add Indicators to Chart: First, apply the mean and standard deviation lines indicator to the chart, then add the MAPE of Expected Value and Percent Residuals indicator to evaluate the accuracy of price forecasts.
- Set Parameters: Set the `Mean Period (Bars)` to be the same value in both the mean and standard deviation lines indicator and the MAPE indicator to ensure accuracy. Adjust the `MAPE Period (Bars)` to fine-tune the length of historical data used in calculating the MAPE.
- Interpret Residuals and MAPE: Use the percent residuals histogram to understand how the actual closing price deviates from predictions. The MAPE line helps track the average prediction accuracy over time.
This tool is particularly useful for traders who want to evaluate the performance of their price prediction models based on the transform model and track how well their expected values, derived from mean and standard deviation lines, align with actual market movements.
Yalnızca davetli komut dosyası
Bu komut dosyasına yalnızca yazar tarafından onaylanan kullanıcılar erişebilir. Kullanmak için izin istemeniz ve almanız gerekir. Bu izin genellikle ödeme yapıldıktan sonra verilir. Daha fazla ayrıntı için aşağıdaki yazarın talimatlarını izleyin veya doğrudan oisigma ile iletişime geçin.
TradingView, yazarına tam olarak güvenmediğiniz ve nasıl çalıştığını anlamadığınız sürece bir komut dosyası için ödeme yapmanızı veya kullanmanızı ÖNERMEZ. Ayrıca topluluk komut dosyaları bölümümüzde ücretsiz, açık kaynaklı alternatifler bulabilirsiniz.
Yazarın talimatları
Feragatname
Yalnızca davetli komut dosyası
Bu komut dosyasına yalnızca yazar tarafından onaylanan kullanıcılar erişebilir. Kullanmak için izin istemeniz ve almanız gerekir. Bu izin genellikle ödeme yapıldıktan sonra verilir. Daha fazla ayrıntı için aşağıdaki yazarın talimatlarını izleyin veya doğrudan oisigma ile iletişime geçin.
TradingView, yazarına tam olarak güvenmediğiniz ve nasıl çalıştığını anlamadığınız sürece bir komut dosyası için ödeme yapmanızı veya kullanmanızı ÖNERMEZ. Ayrıca topluluk komut dosyaları bölümümüzde ücretsiz, açık kaynaklı alternatifler bulabilirsiniz.