OPEN-SOURCE SCRIPT
SP 500 PE Ratio (Loose Date Match)
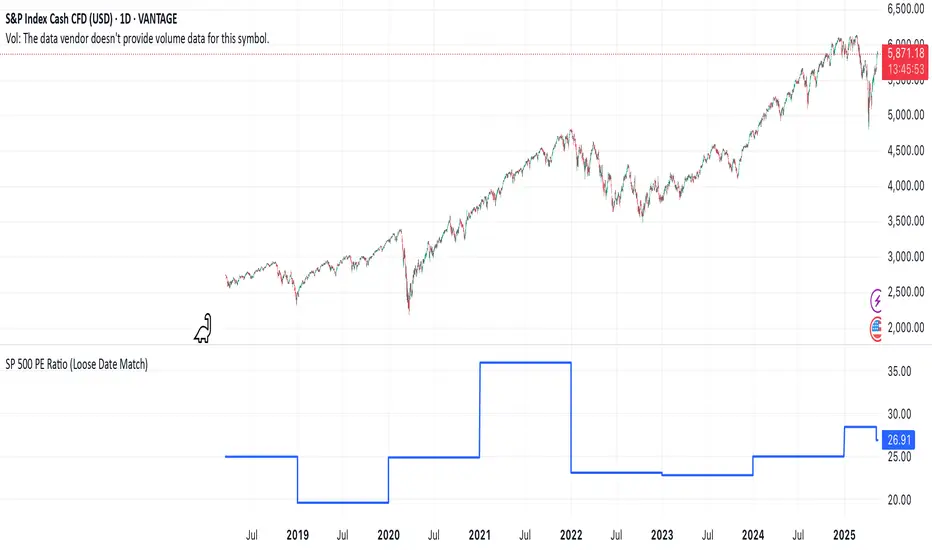
📈 **S&P 500 PE Ratio (from Excel Data)**
This custom indicator visualizes the historical S&P 500 Price-to-Earnings (PE) Ratio loaded from Excel. Each data point represents a snapshot of the market valuation at a specific time, typically on an annual or quarterly basis.
🔹 **What it does:**
- Plots the PE ratio values on the chart aligned with historical dates
- Uses stepwise or linear rendering to account for missing trading days
- Helps identify valuation cycles and extremes (e.g., overvalued vs undervalued)
🔍 **Use case:**
- Long-term market analysis
- Compare PE trends with price performance
- Spot long-term entry/exit zones based on valuation
🛠️ Future plans:
- Add value zone highlighting (e.g., PE > 30 = red, PE < 15 = green)
- Support for dynamic datasets (via Google Sheets or Notion)
Category: `Breadth indicators`, `Cycles`
💡 Source: Manually imported data (can be replaced with any custom macro data series)
Açık kaynak kodlu komut dosyası
Gerçek TradingView ruhuyla, bu komut dosyasının mimarı, yatırımcıların işlevselliğini inceleyip doğrulayabilmesi için onu açık kaynaklı hale getirdi. Yazarı tebrik ederiz! Ücretsiz olarak kullanabilseniz de, kodu yeniden yayınlamanın Topluluk Kurallarımıza tabi olduğunu unutmayın.
Feragatname
Bilgiler ve yayınlar, TradingView tarafından sağlanan veya onaylanan finansal, yatırım, alım satım veya diğer türden tavsiye veya öneriler anlamına gelmez ve teşkil etmez. Kullanım Koşulları bölümünde daha fazlasını okuyun.