OPEN-SOURCE SCRIPT
HL BREAKOUT
The base of the indicator is the breakout of historic High and lows.
There are 3 basic configurations
1° The High length that measure the latest 10 bars and make the "higher high"
2° The Low length taht measure the latest 10 bars and make the "lower low"
3° The Breakout PIPs administrator that defines how much pips are needed from the latest higher high to be defined as a level breakout.
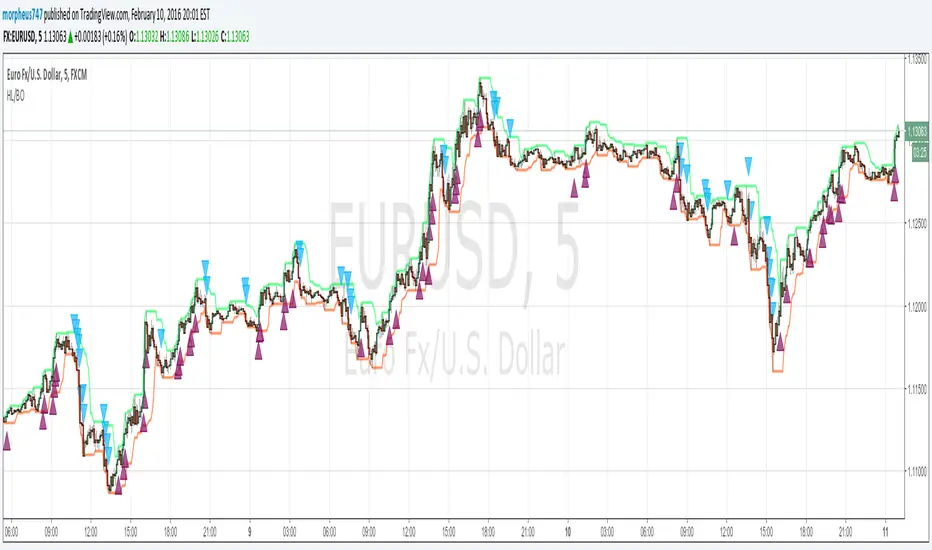
So the strategy is super easy. The indicators show you the 10...20.. or whatever you need old bars high and lows.
When a breakout of that levels occurs and the candle "close" above or below and the close are more than "X" amount of PIPs a marker show up. The marker are the signals of buy and sell
I test some configurations, and work in all timeframes but.
I suggest
10, 10, 0.0003 for timeframes from 1m to 15m
and 10, 10, 0.0005 for timeframes higher than 15m
Maybe you need to test other configurations for 4h 1 day, etc the basics are the same in all timeframes, the main difference is the amount of pips that will be considered as "breakout" the higher timeframe the higher amount you need to prevent false positives.
Last words: 0.000X are for the PIPs for currencies that have 4 or 5 decimals like euro and other, if you use in YEN change it to a configuration of 2 digits decimal. Just that.
Have "fun" !
There are 3 basic configurations
1° The High length that measure the latest 10 bars and make the "higher high"
2° The Low length taht measure the latest 10 bars and make the "lower low"
3° The Breakout PIPs administrator that defines how much pips are needed from the latest higher high to be defined as a level breakout.
So the strategy is super easy. The indicators show you the 10...20.. or whatever you need old bars high and lows.
When a breakout of that levels occurs and the candle "close" above or below and the close are more than "X" amount of PIPs a marker show up. The marker are the signals of buy and sell
I test some configurations, and work in all timeframes but.
I suggest
10, 10, 0.0003 for timeframes from 1m to 15m
and 10, 10, 0.0005 for timeframes higher than 15m
Maybe you need to test other configurations for 4h 1 day, etc the basics are the same in all timeframes, the main difference is the amount of pips that will be considered as "breakout" the higher timeframe the higher amount you need to prevent false positives.
Last words: 0.000X are for the PIPs for currencies that have 4 or 5 decimals like euro and other, if you use in YEN change it to a configuration of 2 digits decimal. Just that.
Have "fun" !
Açık kaynak kodlu komut dosyası
Gerçek TradingView ruhuna uygun olarak, bu komut dosyasının oluşturucusu bunu açık kaynaklı hale getirmiştir, böylece yatırımcılar betiğin işlevselliğini inceleyip doğrulayabilir. Yazara saygı! Ücretsiz olarak kullanabilirsiniz, ancak kodu yeniden yayınlamanın Site Kurallarımıza tabi olduğunu unutmayın.
Feragatname
Bilgiler ve yayınlar, TradingView tarafından sağlanan veya onaylanan finansal, yatırım, işlem veya diğer türden tavsiye veya tavsiyeler anlamına gelmez ve teşkil etmez. Kullanım Şartları'nda daha fazlasını okuyun.