OPEN-SOURCE SCRIPT
[OCT] Moving Average Sigmoid Variance
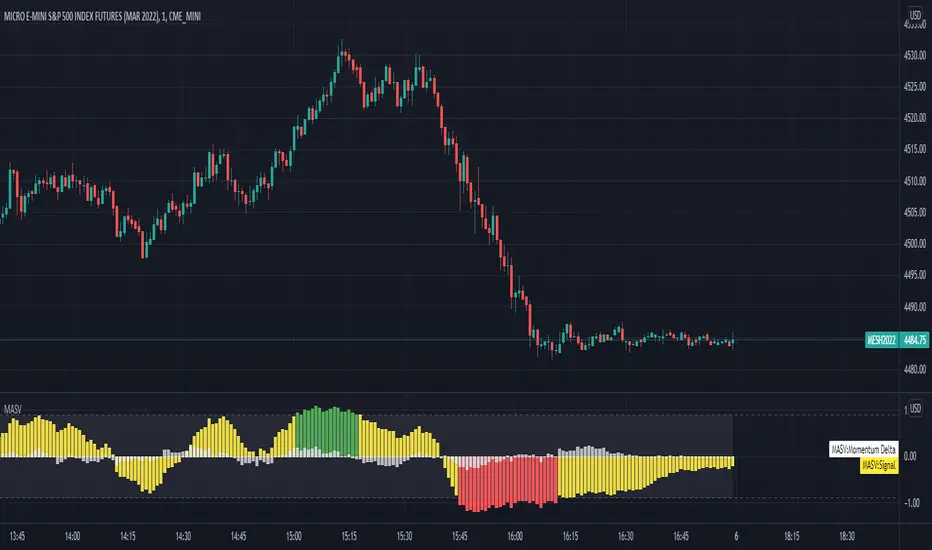
Uses a weighted sigmoid function to gauge the difference between two moving averages. Useful as an additional confirmation source for following trends.
The signal line hovers between -1 and 1, -1 being a negative delta and 1 being a positive delta.
Using a minimum and maximum threshold, a trend can be identified based on how far the signal line crosses the thresholds.
The signal is optionally (enabled by default) adjusted by a "momentum", which is calculated as a moving average of the *change* of a value over time. It's a bit finicky to describe, so please take a look at how it's calculated in code if you wish to use it.
The signal, by default, is green when the value is above the threshold, red when it's below the threshold, and yellow when inside the threshold.
NOTE:
This study is extremely untuned and should not be used as the sole inspiration for taking or exiting a position out of the box.
Please play around with the many available configuration options to fine tune the output to fit your personal strategy.
Configurable options:
- All colors
- All moving average algorithms
- All moving average sources
- All moving average lengths
- Threshold values
- Signal and momentum multipliers
- Whether or not to use the momentum
- Whether or not to plot the momentum
Açık kaynak kodlu komut dosyası
Gerçek TradingView ruhuyla, bu komut dosyasının mimarı, yatırımcıların işlevselliğini inceleyip doğrulayabilmesi için onu açık kaynaklı hale getirdi. Yazarı tebrik ederiz! Ücretsiz olarak kullanabilseniz de, kodu yeniden yayınlamanın Topluluk Kurallarımıza tabi olduğunu unutmayın.
Feragatname
Bilgiler ve yayınlar, TradingView tarafından sağlanan veya onaylanan finansal, yatırım, alım satım veya diğer türden tavsiye veya öneriler anlamına gelmez ve teşkil etmez. Kullanım Koşulları bölümünde daha fazlasını okuyun.