OPEN-SOURCE SCRIPT
Indicator: Raschke Compase [xQT5]
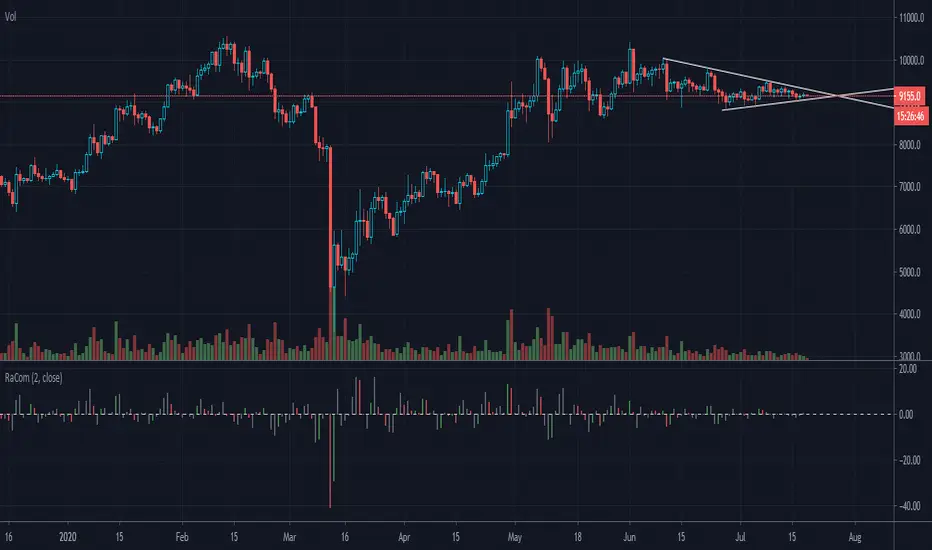
This is an indicator from a book "Street Smarts—High Probability Short Term Trading Strategies" by L. Raschke & L.Connors.
I made it in histogram style for more comfortable reading chart:
- green histogram is buy signal or buy opportunity;
- red histogram is sell signal or sell opportunity;
- gray histogram is forward moving from last signal.
Enjoy it!
I made it in histogram style for more comfortable reading chart:
- green histogram is buy signal or buy opportunity;
- red histogram is sell signal or sell opportunity;
- gray histogram is forward moving from last signal.
Enjoy it!
Açık kaynak kodlu komut dosyası
Gerçek TradingView ruhuyla, bu komut dosyasının mimarı, yatırımcıların işlevselliğini inceleyip doğrulayabilmesi için onu açık kaynaklı hale getirdi. Yazarı tebrik ederiz! Ücretsiz olarak kullanabilseniz de, kodu yeniden yayınlamanın Topluluk Kurallarımıza tabi olduğunu unutmayın.
Feragatname
Bilgiler ve yayınlar, TradingView tarafından sağlanan veya onaylanan finansal, yatırım, alım satım veya diğer türden tavsiye veya öneriler anlamına gelmez ve teşkil etmez. Kullanım Koşulları bölümünde daha fazlasını okuyun.